Direct isolation of human central nervous system stem cells - PubMed (original) (raw)
Direct isolation of human central nervous system stem cells
N Uchida et al. Proc Natl Acad Sci U S A. 2000.
Abstract
Stem cells, which are clonogenic cells with self-renewal and multilineage differentiation properties, have the potential to replace or repair damaged tissue. We have directly isolated clonogenic human central nervous system stem cells (hCNS-SC) from fresh human fetal brain tissue, using antibodies to cell surface markers and fluorescence-activated cell sorting. These hCNS-SC are phenotypically 5F3 (CD133)(+), 5E12(+), CD34(-), CD45(-), and CD24(-/lo). Single CD133(+) CD34(-) CD45(-) sorted cells initiated neurosphere cultures, and the progeny of clonogenic cells could differentiate into both neurons and glial cells. Single cells from neurosphere cultures initiated from CD133(+) CD34(-) CD45(-) cells were again replated as single cells and were able to reestablish neurosphere cultures, demonstrating the self-renewal potential of this highly enriched population. Upon transplantation into brains of immunodeficient neonatal mice, the sorted/expanded hCNS-SC showed potent engraftment, proliferation, migration, and neural differentiation.
Figures
Figure 1
Isolation of human NS-IC from FBr based on cell surface markers. (a) Immunochemical staining of human FSC. Cross sections of human FSC (12 gestational weeks) were fixed with acetone and stained with mAb 5F3 (×10, Left; ×40, Middle) and 5E12 (×40, Right), using peroxidase-labeled secondary antibody with 3-amino-9-ethylcarbazole substrate (red). (b) Flow cytometric analysis of fresh FBr. FBr cells were stained with mAbs as described. A rare subset of FBr cells coexpressed both CD133+ and 5E12+ (Left). The CD133+ FBr cells were further separated based on CD24 expression (Right). Sort regions were set based on isotype controls of FBr. (c) Flow cytometric separation of FBr cells based on CD133 expression. Two cell populations, CD133−CD34−CD45− (CD133−) and CD133+CD34−CD45− (CD133+), were sorted. FACS preenrichment of CD133+ cells followed by a second round of cell sorting resulted in a distinct CD133+ population (second panel). In all subsequent experiments, both CD133− and CD133+ subsets were sorted twice, resulting in CD133− and CD133+ FBr cell fractions with high purity (right two panels).
Figure 2
Limiting dilution analyses of CD133+-sorted hCNS-SC cells. (a) A representative limiting dilution analysis for NS-IC activity in FBr and sorted subsets. FBr (●), CD133− CD34− CD45− (▴), and CD133+ CD34− CD45− (⧫, red line) sorted cell populations were plated in a series of limiting cell doses. FBr and CD133− cells (100–10,000 cells per well) and CD133+ cells (10–300 cells per well) were plated into 96-well plates with a FACS–automated cell deposition unit. Cultures were carried for 6–8 weeks, and wells that did not contain neurospheres were scored as negative. A linear regression analysis was used to determine the frequency of NS-IC (20). (b) Neurospheres generated from a single-cell event. CD133+ CD34− CD45− sorted cell populations from eight different FBr samples were plated in a series of limiting cell doses into 96-well plates with a automated cell deposition unit. Results from eight different samples were combined to generate a plot of the number of cells plated vs. log percentage negative wells with SEM (error bars). Linear correlation of log percentage negative wells and number of CD133+ cells plated indicate a neurosphere initiated from a single-hit event. (c) NS-IC frequencies from unsorted, sorted, and cultured FBr cells. NS-IC frequency in FBr control (n = 8), CD133− (n = 8), CD133+ (n = 8) sorted, and CD133+ sorted/expanded (passage 1, n = 3) cell populations was determined. NS-IC frequencies of individual samples were calculated by linear regression analysis. The average NS-IC frequency in a given population is shown alongside the bars.
Figure 3
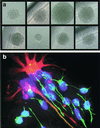
Clonal expansion from single CD133+ cells. (a) Clonal expansion of neural stem/progenitor cells. Neurospheres can be derived from a single sorted CD133+ cell directly isolated from fetal brain or from a single CD133+ cell from sorted/expanded cultured neurospheres. (b) Differentiation capacity of clonally derived neurosphere cells. Progeny of single cell-derived neurospheres can be differentiated into neurons (β-tubulin III, green) and astrocytes (GFAP, red). Nuclei were counterstained with Hoechst 33342 (blue).
Figure 4
Detection of human cells in the olfactory system. CD133+-sorted/expanded human neurosphere cells were transplanted into the lateral ventricles of neonatal NOD-SCID mice. Engraftment of human cells was analyzed 7 months after transplantation. (a–c) SVZ: detection of proliferating human neural cells in the SVZ. Confocal images are of a sagittal section of the transplanted mouse brain stained with anti-human nuclear antigen (a, green) and Ki-67 (b, red) and GFAP (c, blue). Most of the human nuclear antigen positive cells in the SVZ also coexpressed the proliferation marker Ki-67 (c, merged). (d) Schematic diagram of adult mouse brain. (e) RMS: the array of human nuclear antigen+ cells (red) in the RMS was colocalized with β-tubulin III expression (green). Some of these cells were clearly double positive (arrow). (f and_g_) Confocal microscopic analysis of the olfactory bulb. Many human cells were distributed in the olfactory bulb, some of which expressed human N-CAM (green) on their neuronal processes (f). Very rare human dopaminergic neurons were detected [i.e., human nuclei (green), tyrosine hydroxylase (red)] in the periglomerular layer (g, arrow).
Figure 5
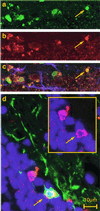
Detection of proliferating and differentiating human cells in the dentate gyrus of hippocampus. (a–c) Confocal microscopic analysis of proliferating human neural cells in the subgranular zone of the dentate gyrus. Transplanted mouse brain was stained with anti-human nuclei (a, green), Ki-67 (b, red), and GFAP (c, blue). Some human nuclear antigen+ cells were costained with Ki-67 (c, merged, arrow). (d) Detection of human neurons in the dentate gyrus. The sagittal section of the transplanted mouse brain was stained with anti-human nuclear antigen (red) and anti-β-tubulin III (green). One of two human nuclear antigen-positive cells was also positive for β-tubulin III (arrow).
Similar articles
- Engraftment of sorted/expanded human central nervous system stem cells from fetal brain.
Tamaki S, Eckert K, He D, Sutton R, Doshe M, Jain G, Tushinski R, Reitsma M, Harris B, Tsukamoto A, Gage F, Weissman I, Uchida N. Tamaki S, et al. J Neurosci Res. 2002 Sep 15;69(6):976-86. doi: 10.1002/jnr.10412. J Neurosci Res. 2002. PMID: 12205691 - Optimized flow cytometric analysis of central nervous system tissue reveals novel functional relationships among cells expressing CD133, CD15, and CD24.
Panchision DM, Chen HL, Pistollato F, Papini D, Ni HT, Hawley TS. Panchision DM, et al. Stem Cells. 2007 Jun;25(6):1560-70. doi: 10.1634/stemcells.2006-0260. Epub 2007 Mar 1. Stem Cells. 2007. PMID: 17332513 - Human neural stem cells differentiate and promote locomotor recovery in an early chronic spinal cord injury NOD-scid mouse model.
Salazar DL, Uchida N, Hamers FP, Cummings BJ, Anderson AJ. Salazar DL, et al. PLoS One. 2010 Aug 18;5(8):e12272. doi: 10.1371/journal.pone.0012272. PLoS One. 2010. PMID: 20806064 Free PMC article. - Stem cells in the central nervous system.
McKay R. McKay R. Science. 1997 Apr 4;276(5309):66-71. doi: 10.1126/science.276.5309.66. Science. 1997. PMID: 9082987 Review. - Mammalian neural stem cells.
Gage FH. Gage FH. Science. 2000 Feb 25;287(5457):1433-8. doi: 10.1126/science.287.5457.1433. Science. 2000. PMID: 10688783 Review.
Cited by
- Human iPSC-derived neural stem cells displaying radial glia signature exhibit long-term safety in mice.
Luciani M, Garsia C, Beretta S, Cifola I, Peano C, Merelli I, Petiti L, Miccio A, Meneghini V, Gritti A. Luciani M, et al. Nat Commun. 2024 Nov 1;15(1):9433. doi: 10.1038/s41467-024-53613-7. Nat Commun. 2024. PMID: 39487141 Free PMC article. - Modeling Glioma Intratumoral Heterogeneity with Primary Human Neural Stem and Progenitor Cells.
Gao D, Liu DD, Eastman AE, Womack NL, Ohene-Gambill BF, Baez M, Weissman IL. Gao D, et al. bioRxiv [Preprint]. 2024 Oct 22:2024.10.20.619254. doi: 10.1101/2024.10.20.619254. bioRxiv. 2024. PMID: 39484434 Free PMC article. Preprint. - CelltypeR: A flow cytometry pipeline to characterize single cells from brain organoids.
Thomas RA, Sirois J, Li S, Gestin A, Deyab G, Piscopo VEC, Lépine P, Mathur M, Chen CX, Soubannier V, Goldsmith TM, Fawaz L, Durcan TM, Fon EA. Thomas RA, et al. iScience. 2024 Jul 30;27(9):110613. doi: 10.1016/j.isci.2024.110613. eCollection 2024 Sep 20. iScience. 2024. PMID: 39224516 Free PMC article. - Emerging roles of prominin-1 (CD133) in the dynamics of plasma membrane architecture and cell signaling pathways in health and disease.
Pleskač P, Fargeas CA, Veselska R, Corbeil D, Skoda J. Pleskač P, et al. Cell Mol Biol Lett. 2024 Mar 26;29(1):41. doi: 10.1186/s11658-024-00554-0. Cell Mol Biol Lett. 2024. PMID: 38532366 Free PMC article. Review. - Current progress and challenges in the development of brain tissue models: How to grow up the changeable brain in vitro?
Salmina AB, Alexandrova OP, Averchuk AS, Korsakova SA, Saridis MR, Illarioshkin SN, Yurchenko SO. Salmina AB, et al. J Tissue Eng. 2024 Mar 20;15:20417314241235527. doi: 10.1177/20417314241235527. eCollection 2024 Jan-Dec. J Tissue Eng. 2024. PMID: 38516227 Free PMC article. Review.
References
- Gage F H. Science. 2000;287:1433–1438. - PubMed
- Weissman I L. Cell. 2000;100:157–168. - PubMed
- McKay R. Science. 1997;276:66–71. - PubMed
MeSH terms
Substances
LinkOut - more resources
Full Text Sources
Other Literature Sources
Medical
Research Materials
Miscellaneous


