The biological lifetime of nitric oxide: implications for the perivascular dynamics of NO and O2 - PubMed (original) (raw)
The biological lifetime of nitric oxide: implications for the perivascular dynamics of NO and O2
D D Thomas et al. Proc Natl Acad Sci U S A. 2001.
Abstract
Endothelial nitric oxide (nitrogen monoxide) is synthesized at the intravascular/extravascular interface. We previously have reported the intravascular half-life of NO, as a result of consumption by erythrocytes, as approximately 2 ms. We report here studies designed to estimate the lifetime of NO in the parenchymal (extravascular) tissue and describe the implications of these results for the distribution of NO and oxygen concentration gradients away from the blood vessel. The rate of consumption of NO by parenchymal cells (hepatocytes) linearly depends on both NO and O(2) concentration. We estimate that the extravascular half-life of NO will range from 0.09 to > 2 s, depending on O2 concentration and thus distance from the vessel. Computer modeling reveals that this phenomenon, coupled with reversible NO inhibition of cellular mitochondrial oxygen consumption, substantially extends the zone of adequate tissue cellular oxygenation away from the blood vessel, with an especially dramatic effect during conditions of increased tissue work (oxygen consumption). This represents a second action of NO, in addition to vasodilation, in enhancing tissue cellular respiration and provides a possible physiological function for the known reversible inhibition of mitochondrial respiration by low concentrations of NO.
Figures
Figure 1
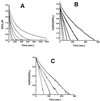
Kinetics and O2 dependence of NO consumption by isolated rat hepatocytes. NO was added at zero time and its concentration was measured electrochemically as described in Materials and Methods. (A) Effects of increasing cell numbers. Top tracing, buffer alone. Next five tracings, increasing cell density in the measuring chamber (0, 2.5 × 10⁴, 5 × 10⁴, 10 × 104, 20 × 104, 40 × 104 cell/ml). (B) First-order plot of data in A. Note nonlinearity of top tracing (buffer alone), because of the fact that this rate is second order in [NO] (4). The linearity of the tracings with cells indicates first-order dependence. (C) Effects of decreasing O2 tension. Oxygen concentrations were 220 μM, 100 μM, 50 μM, and 12 μM, with the most rapid disappearance with the highest [O2]. Cell density was 2 × 10⁵ cell/ml.
Figure 2
Predicted half-life of NO in tissue as a function of O2 concentration (A) and distance from the surface of a blood vessel (B). (A) The rate constant for NO disappearance is 5.38 × 10⁻⁴ M−1⋅s−1⋅(cell/ml)−1 and cell density 108 cell/ml was used. (B) The values for O2 concentration as a function of distance from vessel surface were taken from Filho et al. (16).
Figure 3
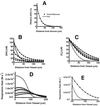
Simulations of the steady-state concentration profiles of NO and O2 and of cellular respiration rate away from the surface of a vessel. (A) Comparison of the results from the equation based on Fick's Law (Eq. 3; solid line) with results from the finite-differences simulation (○). (B) NO concentration away from the vessel. ○, The result with a uniform half-life for NO of 0.092 s and no effect of NO on tissue oxygen consumption. The filled symbols denote results that include both the O2 dependence of cellular NO consumption (Eq. 1) and inhibition of cellular respiration by NO (Eq. 2), with increasing rates of NO formation, which yield steady-state levels at the vessel surface from 15 to 100 nM. (C) O2 concentration away from the vessel. Open symbols denote no NO/O2 interactions and a uniform NO half-life of 0.092 s. Filled symbols denote results that include the O2 dependence of cellular NO consumption and inhibition of cellular respiration by NO. (D) Profile of cellular respiration rate as a function of distance from the surface of a vessel, using Eq. 2. Symbols are as described for B and C. (E) Expansion of the distance scale from D, with no NO/O2 interaction (○) and with NO/O2 interactions and [NO] = 100 nM at the vessel surface.
Figure 4
Effects of increased tissue respiratory demand (work) on steady-state profiles of respiration. (A) Profiles in the absence of coupled NO/O2 diffusion. ○, The same as for Fig. 3_D_ (V_M = 2.5 × 10⁻⁵ Ms−1 for O2 consumption, which corresponds to 0.9 μmol O2 consumed/106 cell per h; ref. 20). □, ▵, and ◊, Results with increasing_V_M for oxygen (5 × 10⁻⁵ Ms−1, 8 × 10⁻⁵ Ms−1, 15 × 10−5 Ms−1, and 20 × 10−5 Ms−1, respectively). (B) Profiles with coupled NO/O2 diffusion. Symbols same as_A. For both plots, the concentrations of NO and O2 at the vessel surface are 15 nM and 56 μM, respectively for the baseline condition (_V_M = 2.5 × 10⁻⁵ Ms−1).
Figure 5
Effects of coupled NO/O2 diffusion on overlap of tissue oxygenation/respiration with increasing intervessel distances. (Left) Rates of respiration surrounding vessels that are separated by 120 μm, 160 μm, 200 μm, and 240 μm (position of vessels denoted by ●), with independent diffusion of NO and O2. (Right) Results similar to the plots on the left but including the mutual effects of NO and O2 on each other's diffusion, as described in the text.
Similar articles
- Oxygen regulates the effective diffusion distance of nitric oxide in the aortic wall.
Liu X, Srinivasan P, Collard E, Grajdeanu P, Lok K, Boyle SE, Friedman A, Zweier JL. Liu X, et al. Free Radic Biol Med. 2010 Feb 15;48(4):554-9. doi: 10.1016/j.freeradbiomed.2009.11.024. Epub 2009 Dec 4. Free Radic Biol Med. 2010. PMID: 19969071 Free PMC article. - Interactions between NO and O2 in the microcirculation: a mathematical analysis.
Lamkin-Kennard KA, Buerk DG, Jaron D. Lamkin-Kennard KA, et al. Microvasc Res. 2004 Jul;68(1):38-50. doi: 10.1016/j.mvr.2004.03.001. Microvasc Res. 2004. PMID: 15219419 - Regulation of oxygen distribution in tissues by endothelial nitric oxide.
Victor VM, Nuñez C, D'Ocón P, Taylor CT, Esplugues JV, Moncada S. Victor VM, et al. Circ Res. 2009 May 22;104(10):1178-83. doi: 10.1161/CIRCRESAHA.109.197228. Epub 2009 Apr 30. Circ Res. 2009. PMID: 19407240 - Role of endothelium-derived nitric oxide in the regulation of cardiac oxygen metabolism: implications in health and disease.
Trochu JN, Bouhour JB, Kaley G, Hintze TH. Trochu JN, et al. Circ Res. 2000 Dec 8;87(12):1108-17. doi: 10.1161/01.res.87.12.1108. Circ Res. 2000. PMID: 11110767 Review. - The vascular wall as a regulator of tissue oxygenation.
Tsai AG, Friesenecker B, Cabrales P, Hangai-Hoger N, Intaglietta M. Tsai AG, et al. Curr Opin Nephrol Hypertens. 2006 Jan;15(1):67-71. doi: 10.1097/01.mnh.0000196147.65330.a3. Curr Opin Nephrol Hypertens. 2006. PMID: 16340669 Review.
Cited by
- Application of Electrode Methods in Studies of Nitric Oxide Metabolism and Diffusion Kinetics.
Liu X, Zweier JL. Liu X, et al. J Electroanal Chem (Lausanne). 2013 Jan 1;688:32-39. doi: 10.1016/j.jelechem.2012.09.038. J Electroanal Chem (Lausanne). 2013. PMID: 23730264 Free PMC article. - Photodynamic Therapy as an Oxidative Anti-Tumor Modality: Negative Effects of Nitric Oxide on Treatment Efficacy.
Girotti AW, Fahey JM, Korbelik M. Girotti AW, et al. Pharmaceutics. 2021 Apr 21;13(5):593. doi: 10.3390/pharmaceutics13050593. Pharmaceutics. 2021. PMID: 33919266 Free PMC article. Review. - Nitric oxide regulation of cellular metabolism: Adaptive tuning of cellular energy.
Pappas G, Wilkinson ML, Gow AJ. Pappas G, et al. Nitric Oxide. 2023 Feb 1;131:8-17. doi: 10.1016/j.niox.2022.11.006. Epub 2022 Dec 5. Nitric Oxide. 2023. PMID: 36470373 Free PMC article. Review. - Cardiac nitric oxide scavenging: role of myoglobin and mitochondria.
Giles AV, Edwards L, Covian R, Lucotte BM, Balaban RS. Giles AV, et al. J Physiol. 2024 Jan;602(1):73-91. doi: 10.1113/JP284446. Epub 2023 Dec 2. J Physiol. 2024. PMID: 38041645 Free PMC article. - Kinetic analysis of DAF-FM activation by NO: toward calibration of a NO-sensitive fluorescent dye.
Namin SM, Nofallah S, Joshi MS, Kavallieratos K, Tsoukias NM. Namin SM, et al. Nitric Oxide. 2013 Jan 15;28:39-46. doi: 10.1016/j.niox.2012.10.001. Epub 2012 Oct 11. Nitric Oxide. 2013. PMID: 23063986 Free PMC article.
References
- Lancaster J R., Jr . In: Nitric Oxide: Biology and Pathobiology. Ignarro L J, editor. San Diego: Academic; 2000. pp. 209–224.
- Palmer R M, Ferrige A G, Moncada S. Nature (London) 1987;327:524–526. - PubMed
- Kelm M, Schrader J. Circ Res. 1990;66:1561–1575. - PubMed
- Ford P C, Wink D A, Stanbury D M. FEBS Lett. 1993;326:1–3. - PubMed
Publication types
MeSH terms
Substances
LinkOut - more resources
Full Text Sources
Other Literature Sources


