Estimation and detection of event-related fMRI signals with temporally correlated noise: a statistically efficient and unbiased approach - PubMed (original) (raw)
Estimation and detection of event-related fMRI signals with temporally correlated noise: a statistically efficient and unbiased approach
M A Burock et al. Hum Brain Mapp. 2000 Dec.
Abstract
Recent developments in analysis methods for event-related functional magnetic resonance imaging (fMRI) has enabled a wide range of novel experimental designs. As with selective averaging methods used in event-related potential (ERP) research, these methods allow for the estimation of the average time-locked response to particular event-types, even when these events occur in rapid succession and in an arbitrary sequence. Here we present a flexible framework for obtaining efficient and unbiased estimates of event-related hemodynamic responses, in the presence of realistic temporally correlated (nonwhite) noise. We further present statistical inference methods based upon the estimated responses, using restriction matrices to formulate temporal hypothesis tests about the shape of the evoked responses. The accuracy of the methods is assessed using synthetic noise, actual fMRI noise, and synthetic activation in actual noise. Actual false-positive rates were compared to nominal false-positive rates assuming white noise, as well as local and global noise estimates in the estimation procedure (assuming white noise resulted in inappropriate inference, while both global and local estimates corrected false-positive rates). Furthermore, both local and global noise estimates were found to increase the statistical power of the hypothesis tests, as measured by the receiver operating characteristics (ROC). This approach thus enables appropriate univariate statistical inference with improved statistical power, without requiring a priori assumptions about the shape or timing of the event-related hemodynamic response.
Figures
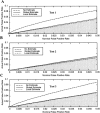
Figure 1
False‐positive rates for three tests and three noise estimates vs. the nominal significance level for synthetic noise data. A: Test 1 (no assumed form). B: Test 2 (assumed peak values). C: Test 3 (assumed hemodynamic shape). In all tests, not estimating the noise parameters produced false‐positive rates significantly different from nominal values, although Test 2 was least sensitive. Values above the shaded region are inappropriately high, while values in the shaded region are too low.
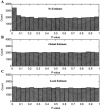
Figure 2
_P_‐value histograms for Test 1 (no assumptions) and three noise estimates. The histograms should be flat if inference is appropriate. A: No noise estimate. B: Global estimate. C: Local estimate. Not including noise estimates (A) produces more extreme p‐values than expected. B and C are relatively flat, indicating that the noise was appropriately estimated and that the test is valid.
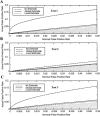
Figure 3
False‐positive rates for three tests and three noise estimates vs. the nominal significance level for actual noise data. A: Test 1 (no assumed form). B: Test 2 (assumed peak values). C: Test 3 (assumed hemodynamic shape). Similar to the synthetic data, not estimating the noise parameters produced false‐positive rates substantially greater than nominal values, although Test 2 was least sensitive. The false‐positive rates were slightly greater than nominal rates even when the noise was estimated. Values above the shaded region are inappropriately high, while values in the shaded region are too low.
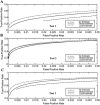
Figure 4
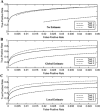
Within‐test comparisons of receiver‐operating‐characteristics (ROCs) as a function of noise estimate for actual fMRI noise data with synthetic activation A: Test 1 (no assumed form). B: Test 2 (assumed three peak values). C: Test 3 (assumed shape). For Tests 1 and 3, the local noise estimate performs best, followed by the global estimate. Test 2 performance is least sensitive to the noise estimate.
Figure 5
Within‐noise estimate comparisons of receiver‐operating‐characteristics (ROCs) as a function of test for actual fMRI noise data with synthetic activation A: No estimate. B: Global estimate. C: Local estimate. Test 1 (no assumptions) performs significantly poorer than the two test with assumptions for all noise estimates. Test 3 (assumed form) has the best performance for all noise estimates.
Figure 6
Comparison of ROCs for all tests and noise estimates. Test 3 with local noise estimates has the best overall performance for all false‐positive rates, with a 540% greater true‐positive rate than Test 1 with a global noise estimate, at the false‐positive rate α = 0.001.
Similar articles
- Efficient design of event-related fMRI experiments using M-sequences.
Buracas GT, Boynton GM. Buracas GT, et al. Neuroimage. 2002 Jul;16(3 Pt 1):801-13. doi: 10.1006/nimg.2002.1116. Neuroimage. 2002. PMID: 12169264 - Deconvolution of event-related fMRI responses in fast-rate experimental designs: tracking amplitude variations.
Hinrichs H, Scholz M, Tempelmann C, Woldorff MG, Dale AM, Heinze HJ. Hinrichs H, et al. J Cogn Neurosci. 2000;12 Suppl 2:76-89. doi: 10.1162/089892900564082. J Cogn Neurosci. 2000. PMID: 11506649 - Effect of confounding variables on hemodynamic response function estimation using averaging and deconvolution analysis: An event-related NIRS study.
Aarabi A, Osharina V, Wallois F. Aarabi A, et al. Neuroimage. 2017 Jul 15;155:25-49. doi: 10.1016/j.neuroimage.2017.04.048. Epub 2017 Apr 25. Neuroimage. 2017. PMID: 28450140 - Hidden Markov event sequence models: toward unsupervised functional MRI brain mapping.
Faisan S, Thoraval L, Armspach JP, Foucher JR, Metz-Lutz MN, Heitz F. Faisan S, et al. Acad Radiol. 2005 Jan;12(1):25-36. doi: 10.1016/j.acra.2004.09.012. Acad Radiol. 2005. PMID: 15691723 - Recent developments in optimal experimental designs for functional magnetic resonance imaging.
Kao MH, Temkit M, Wong WK. Kao MH, et al. World J Radiol. 2014 Jul 28;6(7):437-45. doi: 10.4329/wjr.v6.i7.437. World J Radiol. 2014. PMID: 25071884 Free PMC article. Review.
Cited by
- Increased hippocampal activation in mild cognitive impairment compared to normal aging and AD.
Dickerson BC, Salat DH, Greve DN, Chua EF, Rand-Giovannetti E, Rentz DM, Bertram L, Mullin K, Tanzi RE, Blacker D, Albert MS, Sperling RA. Dickerson BC, et al. Neurology. 2005 Aug 9;65(3):404-11. doi: 10.1212/01.wnl.0000171450.97464.49. Neurology. 2005. PMID: 16087905 Free PMC article. - Cognitive and structural cerebral changes in amnestic mild cognitive impairment due to Alzheimer's disease after multicomponent training.
Teixeira CVL, Ribeiro de Rezende TJ, Weiler M, Magalhães TNC, Carletti-Cassani AFMK, Silva TQAC, Joaquim HPG, Talib LL, Forlenza OV, Franco MP, Nechio PE, Fernandes PT, Cendes F, Balthazar ML. Teixeira CVL, et al. Alzheimers Dement (N Y). 2018 Aug 30;4:473-480. doi: 10.1016/j.trci.2018.02.003. eCollection 2018. Alzheimers Dement (N Y). 2018. PMID: 30258976 Free PMC article. - Combining spatial priors and anatomical information for fMRI detection.
Ou W, Wells WM 3rd, Golland P. Ou W, et al. Med Image Anal. 2010 Jun;14(3):318-31. doi: 10.1016/j.media.2010.02.007. Epub 2010 Mar 6. Med Image Anal. 2010. PMID: 20362488 Free PMC article. - Abnormally persistent fMRI activation during antisaccades in schizophrenia: a neural correlate of perseveration?
Dyckman KA, Lee AK, Agam Y, Vangel M, Goff DC, Barton JJ, Manoach DS. Dyckman KA, et al. Schizophr Res. 2011 Oct;132(1):62-8. doi: 10.1016/j.schres.2011.07.026. Epub 2011 Aug 9. Schizophr Res. 2011. PMID: 21831602 Free PMC article. - Scenes unseen: the parahippocampal cortex intrinsically subserves contextual associations, not scenes or places per se.
Bar M, Aminoff E, Schacter DL. Bar M, et al. J Neurosci. 2008 Aug 20;28(34):8539-44. doi: 10.1523/JNEUROSCI.0987-08.2008. J Neurosci. 2008. PMID: 18716212 Free PMC article.
References
- Andrade A, Paradis AL, Rouquette S, Poline JB (1999): Ambiguous results in functional neuroimaging data analysis due to covariate correlation. NeuroImage 10: 483–486. - PubMed
- Bandetinni PA, Jesmanowicz A, Wong EC, Hyde JS (1993): Processing strategies for time‐course data sets in functional MRI of the human brain. Magn Reson Med 30: 161–173. - PubMed
- Bullmore E, Brammer M, Williams SC, Rabe‐Hesketh S, Janot N, David A, Mellers J, Howard R, Sham P (1996): Statistical methods of estimation and inference for functional MR image analysis. Magn Reson Med 35: 261–77. - PubMed
Publication types
MeSH terms
LinkOut - more resources
Full Text Sources
Medical
Research Materials
