Chilling tolerance in Arabidopsis involves ALA1, a member of a new family of putative aminophospholipid translocases - PubMed (original) (raw)
. 2000 Dec;12(12):2441-2454.
Affiliations
- PMID: 11148289
- PMCID: PMC102229
Chilling tolerance in Arabidopsis involves ALA1, a member of a new family of putative aminophospholipid translocases
E Gomès et al. Plant Cell. 2000 Dec.
Abstract
The lipid composition of membranes is a key determinant for cold tolerance, and enzymes that modify membrane structure seem to be important for low-temperature acclimation. We have characterized ALA1 (for aminophospholipid ATPase1), a novel P-type ATPase in Arabidopsis that belongs to the gene family ALA1 to ALA11. The deduced amino acid sequence of ALA1 is homologous with those of yeast DRS2 and bovine ATPase II, both of which are putative aminophospholipid translocases. ALA1 complements the deficiency in phosphatidylserine internalization into intact cells that is exhibited by the drs2 yeast mutant, and expression of ALA1 results in increased translocation of aminophospholipids in reconstituted yeast membrane vesicles. These lines of evidence suggest that ALA1 is involved in generating membrane lipid asymmetry and probably encodes an aminophospholipid translocase. ALA1 complements the cold sensitivity of the drs2 yeast mutant. Downregulation of ALA1 in Arabidopsis results in cold-affected plants that are much smaller than those of the wild type. These data suggest a link between regulation of transmembrane bilayer lipid asymmetry and the adaptation of plants to cold.
Figures
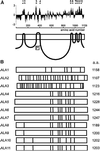
Figure 1.
Sequence Analysis of Members of the ALA Gene Family. (A) Prediction of putative membrane-spanning domains of ALA1. Hydropathy plots were performed with a window of 17 amino acids (Kyte and Doolittle, 1982). Predicted membrane-spanning domains were confirmed by referring to the P-type ATPase database (
http://biobase.dk/\~axe/Patbase.html
) and are marked at top as bars designated 1 to 10. At bottom is shown a simplistic model of the protein. The boxed P denotes the phosphorylation site. (B) Distribution of introns and exons in the ALA gene family. a.a., amino acids. The positions of introns are shown by a vertical line within a box representing the coding sequence.
Figure 2.
Phylogenetic Tree of Conserved Sequence Segments of Selected P-Type ATPases. The sequences are as follows. Type P4 ATPases: ALA1 to ALA11 (see Table 1 for accession numbers), Arabidopsis thaliana; YER166w (P32660), Saccharomyces cerevisiae; YDR093w (Q12675), S. cerevisiae; DRS2 (P39524), S. cerevisiae; ATPase II α1 (Q29449), Bos taurus; ATPase II α2 (Q9Y2Q0), Homo sapiens; FIC1 (O43520), H. sapiens; YMR162c (Q12674), S. cerevisiae; and NEO1 (P40527), S. cerevisiae. Type P2B ATPases: autoinhibited Ca2+-ATPase ACA2 (O81108), A. thaliana. Type P2A ATPases: endoplasmic reticulum–type Ca2+-ATPase (O04987), A. thaliana. Type P3A ATPases: plasma membrane H+-ATPase AHA2 (P19456), A. thaliana. The tree is based on the Fitch–Margoliash and least-squares method (PHYLIP; Felsenstein, 1989). The conserved segments used in the analysis are defined in Axelsen and Palmgren (1998).
Figure 3.
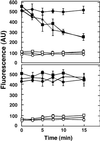
Influence of ALA1 Expression on Aminophospholipid Flipping in Intact Yeast Cells. (Top) 2-(6-[7-nitrobenz-2-oxa-1,3-diazol-4-yl]-amino)hexanoyl (NBD)- phosphatidylserine (PS). (Bottom) NBD-PC. Internalization of NBD phospholipids by wild-type, drs2, and _drs2_-pYES2-ALA1 yeast cells was assayed. The outer leaflet of the yeast cell plasma membrane was labeled with fluorescent phospholipid analogs, and internalization was measured as a function of time. Fluorescence intensities are indicated in arbitrary units (AU). Values are means ±
sd
for three independent experiments, each with duplicate samples. Transport of NBD-PS (top) and NBD-PC (bottom) is shown for wild type (filled squares), drs2 (filled circles), and _drs2_-pYES2-ALA1 (filled triangles). Background (fatty acid–free BSA was omitted from the assay) supernatant values are as follows: wild-type (open squares), drs2 (open circles), and _drs2_-pYES-ALA1 (open triangles) strains.
Figure 4.
Measurement of NBD-PS Translocase Activity in Reconstituted Yeast Microsomal Vesicles. The assay was based on the reduction of the fluorescent aryl-nitro group of NBD phospholipids into a nonfluorescent aryl-amino group. Fluorescence intensity was recorded for 10 min (FT). The first arrow indicates addition of 30 μL of 1 M sodium dithionite in 1 M Tris-HCl, pH 10.0, to the reconstituted microsomes; the fluorescence was recorded after 10 min (FD). Membrane-impermeable sodium dithionite reduces the fluorescent aryl-nitro group of NBD phospholipids present in the outer leaflet of the vesicle membrane (Suzuki et al., 1997). The second arrow indicates addition of 100 μL of 30% Triton X-100 to disrupt the microsomal vesicles and allow sodium dithionite to quench fluorescence from the inner leaflet–resident NDB phospholipids; the fluorescence was recorded (F0). The fractions of NBD phospholipids present in the inner and outer leaflets were calculated from the following equations (Suzuki et al., 1997): ;
. −ATP, ATP was omitted from the assay; +ATP, ATP (3 mM) was included in the reaction mixture; AU, arbitrary units.
Figure 5.
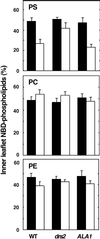
ATP-Dependent Translocation of NBD-Labeled Phospholipids by Reconstituted Microsomes Derived from Wild-Type, drs2, or _drs2_-pYES2-ALA1 Yeast Strains. (Top) NBC-PS. (Center) NBD-PC. (Bottom) NBD-PE. Paired bars at left show results in wild-type yeast (WT); at center, drs2 yeast; at right, drs2 yeast expressing ALA1. Solid black bars show results without ATP; open white bars, results with ATP. Error bars indicate standard errors of the mean ().
Figure 6.
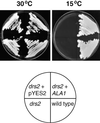
Cold-Tolerant Phenotype of a drs2 Yeast Mutant Complemented by ALA1. The drs2 null mutant (JWY2197; MATα ura3-52 drs2::TRP1 leu2-1 his3-11 lys2-801) was transformed with plasmid pYES2-ALA1 (ALA1) or with the empty pYES2 vector. The wild-type yeast strain (DS94; MATα ura3-52 trp1-1 leu2-3 his3-11 lys2-801) served as a control. Yeast was plated onto amino acid–supplemented synthetic minimal medium containing 2% galactose. Cells were grown for 3 days at 30°C or for 14 days at 15°C.
Figure 7.
Decrease in Expression of ALA1 in ALA1 Antisense Arabidopsis. _ALA1_-specific transcripts (ALA1) were amplified from total RNA derived from wild-type (WT) and different antisense plants (lines 2, 7, and 24 [L2, L7, and L24]) by RT-PCR. As an internal control, the actin AAc1 transcript was amplified by RT-PCR.
Figure 8.
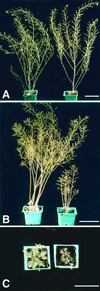
Effect of Downregulation of ALA1 in Arabidopsis. Growth of wild-type (left) and ALA1 antisense (line 7; right) plants at different temperatures. (A) Normal temperature (20 to 25°C). (B) Low temperature (8 to 12°C), lateral view. (C) Low temperature (8 to 12°C), top view. .
Figure 9.
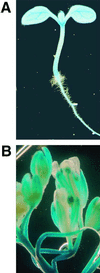
Activity of the GUS Reporter Gene in Transgenic Arabidopsis Containing the pALA1–GUS Fusion. (A) GUS activity in a 6-day-old seedling. (B) GUS expression pattern in flowers.
Figure 10.
ALA1 Expression in Various Organs of Arabidopsis. _ALA1_-specific transcripts (ALA1) were amplified by RT-PCR from total RNA derived from different organs. The expected size of the resulting cDNA fragment was 839 bp. As an internal control, the actin Aac1 transcript was also amplified by RT-PCR. Sizes of the molecular length standards (M) run in parallel are indicated in kilobases (kb) at the left.
Similar articles
- IRREGULAR TRICHOME BRANCH 2 (ITB2) encodes a putative aminophospholipid translocase that regulates trichome branch elongation in Arabidopsis.
Zhang X, Oppenheimer DG. Zhang X, et al. Plant J. 2009 Oct;60(2):195-206. doi: 10.1111/j.1365-313X.2009.03954.x. Epub 2009 Jul 16. Plant J. 2009. PMID: 19566596 - A putative plant aminophospholipid flippase, the Arabidopsis P4 ATPase ALA1, localizes to the plasma membrane following association with a β-subunit.
López-Marqués RL, Poulsen LR, Palmgren MG. López-Marqués RL, et al. PLoS One. 2012;7(4):e33042. doi: 10.1371/journal.pone.0033042. Epub 2012 Apr 13. PLoS One. 2012. PMID: 22514601 Free PMC article. - Control of the transmembrane phospholipid distribution in eukaryotic cells by aminophospholipid translocase.
Devaux PF, Zachowski A, Morrot G, Cribier S, Fellmann P, Geldwerth D, Bitbol M, Herve P. Devaux PF, et al. Biotechnol Appl Biochem. 1990 Oct;12(5):517-22. Biotechnol Appl Biochem. 1990. PMID: 2288706 Review. - Aminophospholipid translocase and proteins involved in transmembrane phospholipid traffic.
Dolis D, Moreau C, Zachowski A, Devaux PF. Dolis D, et al. Biophys Chem. 1997 Oct;68(1-3):221-31. doi: 10.1016/s0301-4622(97)00048-3. Biophys Chem. 1997. PMID: 9468621 Review.
Cited by
- Genetic approaches towards overcoming water deficit in plants - special emphasis on LEAs.
Khurana P, Vishnudasan D, Chhibbar AK. Khurana P, et al. Physiol Mol Biol Plants. 2008 Oct;14(4):277-98. doi: 10.1007/s12298-008-0026-y. Epub 2009 Feb 26. Physiol Mol Biol Plants. 2008. PMID: 23572894 Free PMC article. - Deficiencies in cluster-2 ALA lipid flippases result in salicylic acid-dependent growth reductions.
Davis JA, Poulsen LR, Kjeldgaard B, Moog MW, Brown E, Palmgren M, López-Marqués RL, Harper JF. Davis JA, et al. Physiol Plant. 2024 Mar-Apr;176(2):e14228. doi: 10.1111/ppl.14228. Physiol Plant. 2024. PMID: 38413387 - Inventory of the superfamily of P-type ion pumps in Arabidopsis.
Axelsen KB, Palmgren MG. Axelsen KB, et al. Plant Physiol. 2001 Jun;126(2):696-706. doi: 10.1104/pp.126.2.696. Plant Physiol. 2001. PMID: 11402198 Free PMC article. - Arabidopsis P4 ATPase-mediated cell detoxification confers resistance to Fusarium graminearum and Verticillium dahliae.
Wang F, Li X, Li Y, Han J, Chen Y, Zeng J, Su M, Zhuo J, Ren H, Liu H, Hou L, Fan Y, Yan X, Song S, Zhao J, Jin D, Zhang M, Pei Y. Wang F, et al. Nat Commun. 2021 Nov 5;12(1):6426. doi: 10.1038/s41467-021-26727-5. Nat Commun. 2021. PMID: 34741039 Free PMC article. - ALA10, a Phospholipid Flippase, Controls FAD2/FAD3 Desaturation of Phosphatidylcholine in the ER and Affects Chloroplast Lipid Composition in Arabidopsis thaliana.
Botella C, Sautron E, Boudiere L, Michaud M, Dubots E, Yamaryo-Botté Y, Albrieux C, Marechal E, Block MA, Jouhet J. Botella C, et al. Plant Physiol. 2016 Mar;170(3):1300-14. doi: 10.1104/pp.15.01557. Epub 2015 Nov 30. Plant Physiol. 2016. PMID: 26620528 Free PMC article.
References
- Axelsen, K.B., and Palmgren, M.G. (1998). Evolution of substrate specificities in the P-type ATPase superfamily. J. Mol. Evol. 46 84–101. - PubMed
- Browse, J., and Somerville, C. (1991). Glycerolipid synthesis: Biochemistry and regulation. Annu. Rev. Plant Physiol. Plant Mol. Biol. 42 467–506.
- Cevc, G. (1991). How membrane chain-melting phase-transition temperature is affected by the lipid chain asymmetry and degree of unsaturation: An effective chain-length model. Biochemistry 30 7186–7193. - PubMed
Publication types
MeSH terms
Substances
LinkOut - more resources
Full Text Sources
Molecular Biology Databases
