Growth arrest of individual senile plaques in a model of Alzheimer's disease observed by in vivo multiphoton microscopy - PubMed (original) (raw)
Growth arrest of individual senile plaques in a model of Alzheimer's disease observed by in vivo multiphoton microscopy
R H Christie et al. J Neurosci. 2001.
Abstract
In Alzheimer's disease, amyloid-beta peptide aggregates in the extracellular space to form senile plaques. The process of plaque deposition and growth has been modeled on the basis of in vitro experiments in ways that lead to divergent predictions: either a diffusion-limited growth model in which plaques grow by first-order kinetics, or a dynamic model of continual deposition and asymmetrical clearance in which plaques reach a stable size and stop growing but evolve morphologically over time. The models have not been tested in vivo because plaques are too small (by several orders of magnitude) for conventional imaging modalities. We now report in vivo multiphoton laser scanning imaging of thioflavine S-stained senile plaques in the Tg2576 transgenic mouse model of Alzheimer's disease to test these biophysical models and show that there is no detectable change in plaque size over extended periods of time. Qualitatively, geometric features remain unchanged over time in the vast majority of the 349 plaques imaged and re-imaged. Intervals as long as 5 months were obtained. Nonetheless, rare examples of growth or shrinkage of individual plaques do occur, and new plaques appear between imaging sessions. These results indicate that thioflavine S-positive plaques appear and then are stable, supporting a dynamic feedback model of plaque growth.
Figures
Fig. 1.
Preparation of skull for in vivo_imaging. a, Gross appearance of skull through dissecting microscope before imaging. The pial vasculature is visible through the intact but thinned region of skull. Anterior midline sutures are also visible in the image. Scale marks are spaced 1 mm apart.b, Schematic diagram of the microscope objective during imaging. The thinned area of skull is bathed in a pool of ACSF (light gray) that is retained by a ring of bone wax (dark gray). A small break is made in the lateral wall of the thinned area to allow for thioflavine S entry. c,In vivo visualization of thioflavine S-positive amyloid in a 15-month-old Tg2576 mouse. A single optical section near the surface of the skull is shown. Thioflavine S-positive amyloid angiopathy is visible ringing the pial arteriole in this image. The fainter autofluorescence of the skull bone is visible in the_bottom right corner; the fibrous autofluorescence of the dura is visible as a_band_ at bottom right. d, Another optical section from the same z_-series as_c, but 50 μm deeper into the brain, showing a thioflavine S-positive amyloid deposit in layer 1 of the mouse cortex.e, Perpendicular volume rendering of the entire stack of images, with the skull visible at the top, the amyloid-encrusted pial vessel just beneath, and the thioflavine S-positive plaque deep in the living brain. The autofluorescent dura can also be seen as a faint layer between the vessel and the skull. The approximate levels of optical sections shown in c and_d_ are represented by dotted lines. Scale bars, 25 μm.
Fig. 2.
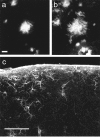
To confirm that the thioflavine S-positive structures were indeed senile plaques, thioflavine S and an anti-amyloid-β monoclonal antibody, cy3-labeled 10D5 (Elan Pharmaceuticals), were applied to the surface of a fixed but intact Tg2576 brain. a, Fluorescence emission in the range 380–480 nm shows thioflavine S staining the amyloid core of a plaque ∼40 μm deep into the brain. Scale bar, 10 μm.b, Emission in the 560–650 nm range shows the Cy3–10D5 staining of the same Aβ surrounding the thioflavine S-positive core.c, Glial fibrillary acidic protein immunoreactivity in a section through the area imaged by multiphoton microscopy 2 d previously. Sparse immunoreactive astrocytes, not substantially different from adjacent (nonimaged) cortex, suggest minimal tissue response to imaging. Scale bar, 100 μm.
Fig. 3.
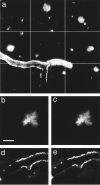
In vivo imaging of thioflavine S-positive amyloid deposition in a Tg2576 mouse. a, A 3 × 3 montage of 60× fields acquired on initial imaging day. Optical sections were obtained every 2 μm for a distance of 200 μm from the inner surface of the skull; images were aligned in the_x_, y, and z axes, then projected onto a single image revealing amyloid angiopathy and senile plaques. b, In vivo imaging of a thioflavine S-positive plaque ∼40 μm beneath the skull surface. This image is a single optical section through the body of the plaque. Scale bar, 10 μm. c, The same plaque as in_b_, re-imaged 2 d later under identical imaging conditions. d, Single optical section showing thioflavine S-positive amyloid angiopathy associated with a pial arteriole. e, The same arteriole as d, imaged after 2 d.
Fig. 4.
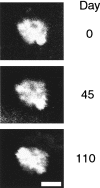
Sequential imaging of a plaque over time. Images of a single, identified plaque were obtained at the initial imaging session and again 45 and 110 d later in a live mouse. Fine details of the plaque are clearly recognizable over these ranges of time. Scale bar, 20 μm.
Fig. 5.
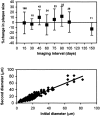
Analysis of variability of plaque measurements. Top, Percentage change (average ± SD) for all plaque measurements binned into 0.5 month groups shows no trend in either the average measure or the variability of measurement over the time interval examined. N values for each measurement are noted above the SD bars.Bottom, Linear regression plot of initial measurement and subsequent measurement for all time intervals, showing tight correlation for all plaque sizes. The slope of the line approaches unity (0.98) with a correlation coefficient_R_2 = 0.89.
Fig. 6.
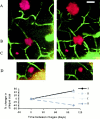
A subpopulation of plaques change size over time. The images are two-channel volume-rendered stacks of thioflavine S plaques (red) and fluorescein angiograms (green) taken from the same animal at the initial imaging session (left images) and 104 d later (right images). Four clearly imaged plaques can be seen in these volumes, labeled A_–_D. The autofluorescence of the dura appears at the upper edge of the volume stacks and appears slightly different in the images here and in Figure6 because the image stacks are not exactly coincident at their initial depth. The graph below represents the percentage change in diameter for each plaque. The plaques labeled A and_B_ increase in size by ∼50%, plaque _C_remains the same size, and plaque D decreases by 40%. Scale bar, 20 μm.
Fig. 7.
Appearance of a novel plaque in the imaged region.a, Volume rendering of a set of three plaques during an initial imaging session. b, Volume rendering of the same region imaged 64 d later, showing the initial plaques joined by a novel thioflavine S-positive plaque. The fibrous autofluorescence at_bottom left_ is dura mater. Scale bar, 50 μm.
Similar articles
- In vivo multiphoton imaging of a transgenic mouse model of Alzheimer disease reveals marked thioflavine-S-associated alterations in neurite trajectories.
D'Amore JD, Kajdasz ST, McLellan ME, Bacskai BJ, Stern EA, Hyman BT. D'Amore JD, et al. J Neuropathol Exp Neurol. 2003 Feb;62(2):137-45. doi: 10.1093/jnen/62.2.137. J Neuropathol Exp Neurol. 2003. PMID: 12578223 - In vivo imaging of reactive oxygen species specifically associated with thioflavine S-positive amyloid plaques by multiphoton microscopy.
McLellan ME, Kajdasz ST, Hyman BT, Bacskai BJ. McLellan ME, et al. J Neurosci. 2003 Mar 15;23(6):2212-7. doi: 10.1523/JNEUROSCI.23-06-02212.2003. J Neurosci. 2003. PMID: 12657680 Free PMC article. - In vivo multiphoton imaging reveals gradual growth of newborn amyloid plaques over weeks.
Burgold S, Bittner T, Dorostkar MM, Kieser D, Fuhrmann M, Mitteregger G, Kretzschmar H, Schmidt B, Herms J. Burgold S, et al. Acta Neuropathol. 2011 Mar;121(3):327-35. doi: 10.1007/s00401-010-0787-6. Epub 2010 Dec 7. Acta Neuropathol. 2011. PMID: 21136067 Free PMC article. - Alzheimer's disease: what multiphoton microscopy teaches us.
Bacskai BJ, Hyman BT. Bacskai BJ, et al. Neuroscientist. 2002 Oct;8(5):386-90. doi: 10.1177/107385802236963. Neuroscientist. 2002. PMID: 12374422 Review. - Preclinical characterization of amyloid imaging probes with multiphoton microscopy.
Skoch J, Hyman BT, Bacskai BJ. Skoch J, et al. J Alzheimers Dis. 2006;9(3 Suppl):401-7. doi: 10.3233/jad-2006-9s345. J Alzheimers Dis. 2006. PMID: 16914878 Review.
Cited by
- VE-cadherin in arachnoid and pia mater cells serves as a suitable landmark for in vivo imaging of CNS immune surveillance and inflammation.
Mapunda JA, Pareja J, Vladymyrov M, Bouillet E, Hélie P, Pleskač P, Barcos S, Andrae J, Vestweber D, McDonald DM, Betsholtz C, Deutsch U, Proulx ST, Engelhardt B. Mapunda JA, et al. Nat Commun. 2023 Sep 20;14(1):5837. doi: 10.1038/s41467-023-41580-4. Nat Commun. 2023. PMID: 37730744 Free PMC article. - Long-Term Repeatable In Vivo Monitoring of Amyloid-β Plaques and Vessels in Alzheimer's Disease Mouse Model with Combined TPEF/CARS Microscopy.
Luo Z, Xu H, Samanta S, Zhang R, Luo G, Wang Y, Liu L, Weng X, He J, Liao C, Wang Y, Guo B, Qu J. Luo Z, et al. Biomedicines. 2022 Nov 16;10(11):2949. doi: 10.3390/biomedicines10112949. Biomedicines. 2022. PMID: 36428517 Free PMC article. - A Model of Discovery: The Role of Imaging Established and Emerging Non-mammalian Models in Neuroscience.
Haynes EM, Ulland TK, Eliceiri KW. Haynes EM, et al. Front Mol Neurosci. 2022 Apr 14;15:867010. doi: 10.3389/fnmol.2022.867010. eCollection 2022. Front Mol Neurosci. 2022. PMID: 35493325 Free PMC article. Review. - Optical Imaging of Beta-Amyloid Plaques in Alzheimer's Disease.
Luo Z, Xu H, Liu L, Ohulchanskyy TY, Qu J. Luo Z, et al. Biosensors (Basel). 2021 Jul 29;11(8):255. doi: 10.3390/bios11080255. Biosensors (Basel). 2021. PMID: 34436057 Free PMC article. Review. - Visualization of neurofibrillary tangle maturity in Alzheimer's disease: A clinicopathologic perspective for biomarker research.
Moloney CM, Lowe VJ, Murray ME. Moloney CM, et al. Alzheimers Dement. 2021 Sep;17(9):1554-1574. doi: 10.1002/alz.12321. Epub 2021 Apr 2. Alzheimers Dement. 2021. PMID: 33797838 Free PMC article. Review.
References
- Denk W, Strickler JH, Webb WW. Two-photon laser scanning fluorescence microscopy. Science. 1990;248:73–76. - PubMed
- Esler WP, Stimson ER, Ghilardi JR, Vinters HV, Lee JP, Mantyh PW, Maggio JE. In vitro growth of Alzheimer's disease beta-amyloid plaques displays first-order kinetics. Biochemistry. 1996;35:749–757. - PubMed
- Hilbich C, Kisters-Woike B, Reed J, Masters CL, Beyreuther K. Aggregation and secondary structure of synthetic amyloid beta A4 peptides of Alzheimer's disease. J Mol Biol. 1991;218:149–163. - PubMed
Publication types
MeSH terms
Substances
Grants and funding
- R01 AG008487/AG/NIA NIH HHS/United States
- T32 GM007753/GM/NIGMS NIH HHS/United States
- P01 AG015453/AG/NIA NIH HHS/United States
- P01 AG15453/AG/NIA NIH HHS/United States
- T32GM07753/GM/NIGMS NIH HHS/United States
- AG08487/AG/NIA NIH HHS/United States
LinkOut - more resources
Full Text Sources
Other Literature Sources
Medical

