Microarray analysis of diurnal and circadian-regulated genes in Arabidopsis - PubMed (original) (raw)
Microarray analysis of diurnal and circadian-regulated genes in Arabidopsis
R Schaffer et al. Plant Cell. 2001 Jan.
Abstract
Plants respond to day/night cycling in a number of physiological ways. At the mRNA level, the expression of some genes changes during the 24-hr period. To identify novel genes regulated in this way, we used microarrays containing 11,521 Arabidopsis expressed sequence tags, representing an estimated 7800 unique genes, to determine gene expression levels at 6-hr intervals throughout the day. Eleven percent of the genes, encompassing genes expressed at both high and low levels, showed a diurnal expression pattern. Approximately 2% cycled with a circadian rhythm. By clustering microarray data from 47 additional nonrelated experiments, we identified groups of genes regulated only by the circadian clock. These groups contained the already characterized clock-associated genes LHY, CCA1, and GI, suggesting that other key circadian clock genes might be found within these clusters.
Figures
Figure 1.
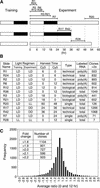
Harvesting Regimen. (A) Plants were trained in 12-hr-light/12-hr-dark cycles and then harvested at different times (except for R28 plants, which were grown in continuous light). Black bars represent dark, and white bars represent light. Slide names of the microarrays comparing different time points are shown and can be accessed via the Stanford Microarray Database (SMD) (
http://genome-www.stanford.edu/microarray
). (B) Table of microarray results shows the slide name, light regimen of the training and experimental periods, Cy dye allocation, type of repetition conducted, RNA labeling method, and the number of clones showing greater than twofold ratios. DD, continuous dark; LD, 12-hr light/dark cycles; LL, continuous light; technical, a repetition that used the same RNA; biological, a repetition that used RNA from different plants; single, an experiment that was not repeated. (C) Distribution of the average ratios from experiments comparing 0- and 12-hr time points. Small variations in the cutoff value greatly changed the number of clones selected, as shown by the inset table.
Figure 2.
Identification of Cycling Genes on the Array. (A) The distribution of known cycling genes on the array is shown. The averages of the four 0- and 12-hr experiments (x axis) were plotted against the ratio from the first 0- and 12-hr experiment (R2) (y axis). Ratios >1 represent genes highly expressed in the morning (top right quadrant), and ratios <1 represent genes highly expressed in the afternoon (bottom left quadrant). Known circadian genes with high expression in the morning or afternoon are shown in red or green, respectively. (B) The average ratios for LHY, CCA1, CAB, GI, CCR2, CCR1, and CAT3 plotted in log space are shown. Positive values represent high expression at 0 hr; negative values represent low expression at 0 hr and high expression at the other times. A twofold difference in expression equals 0.69 and −0.69, as shown by the dashed lines. Error bars represent standard deviation values for each time point. av, average. (C) Distribution of signal intensities of the differentially expressed genes compared with the complete clone set is shown. The sums of the normalized intensities for all of the experiments were plotted. Intensities of clones showing values at three- to eightfold those of the background are shown as shaded bars. (D) As a negative control, ratios of the 0- and 24-hr experiment were plotted against the average ratios of 0- and 12-hr time points. Black spots represent ratios of ESTs in the first 0- and 12-hr experiment (R2) (as in [A]). Blue spots represent the ratios of expression between 0 and 24 hr (R7). Clones showing a difference of expression between 0 and 12 hr do not show a difference between the 0- and 24-hr time points.
Figure 3.
Comparison of Different Cycling Patterns. The 206 clones with both diurnal cycling and differential expression in the dark were clustered. Five representative patterns, each with an idealized graph representing patterns of expression, are shown. Arrows indicate similar times. For the clusters, green represents expression that is greater in the afternoon, and red represents expression that is greater in the morning. cyc dark, differences in darkness; cyc light, differences in continuous light (of trained plants); cont light, differences in plants grown in continuous light. The protein with the most similar BLAST score is shown. Numbers above the clusters represent time points. Graph I represents 61 circadian genes with high expression in the morning. Graph II represents 78 circadian genes with high expression in the afternoon with (a) longer time of expression and (b) shorter time of expression. Graph III represents 23 genes induced in light and repressed in dark, and graph IV represents 44 genes repressed in light and induced in dark.
Figure 4.
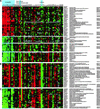
Clustering Different Experiments. Data from the 831 genes showing a diurnal expression pattern were clustered with data from 47 experiments in the SMD. A selection of clusters is shown here along with the name of each EST, the protein showing the highest homology, and the P score. Asterisks denote genes with lower expression levels. (A) Genes with predominantly circadian-regulated expression. (B) Photosynthetic genes that cluster into one highly expressed group in the morning and show differential tissue expression. (C) Genes that peak in expression in the afternoon and exhibit differential tissue expression.
References
- Ahmad, M., and Cashmore, A.R. (1993). HY4 gene of A. thaliana encodes a protein with characteristics of a blue-light photoreceptor. Nature 366 162–166. - PubMed
- Ballare, C.L. (1999). Keeping up with the neighbours: Phytochrome sensing and other signalling mechanisms. Trends Plant Sci. 4 97–102. - PubMed
- Casper, T. (1994). Genetic dissection of the biosynthesis, degradation, and biological functions of starch. In Arabidopsis, E.M. Meyerowitz and C.R. Somerville, eds (Cold Spring Harbor, NY: Cold Spring Harbor Laboratory Press), pp. 913–936.
- Chang, S., Puryear, J., and Cairney, J. (1993). A simple and efficient method for isolating RNA from pine trees. Plant Mol. Biol. Rep. 11 113–116.


