Direct evidence of active and rapid nuclear degradation triggered by vacuole rupture during programmed cell death in Zinnia - PubMed (original) (raw)
Direct evidence of active and rapid nuclear degradation triggered by vacuole rupture during programmed cell death in Zinnia
K Obara et al. Plant Physiol. 2001 Feb.
Abstract
Differentiation into a tracheary element (TE) is a typical example of programmed cell death (PCD) in the developmental processes of vascular plants. In the PCD process the TE degrades its cellular contents and becomes a hollow corpse that serves as a water conduct. Using a zinnia (Zinnia elegans) cell culture we obtained serial observations of single living cells undergoing TE PCD by confocal laser scanning microscopy. Vital staining was performed and the relative fluorescence intensity was measured, revealing that the tonoplast of the swollen vacuole in TEs loses selective permeability of fluorescein just before its physical rupture. After the vacuole ruptured the nucleus was degraded rapidly within 10 to 20 min. No prominent chromatin condensation or nuclear fragmentation occurred in this process. Nucleoids in chloroplasts were also degraded in a similar time course to that of the nucleus. Degradations did not occur in non-TEs forced to rupture the vacuole by probenecid treatment. These results demonstrate that TE differentiation involves a unique type of PCD in which active and rapid nuclear degradation is triggered by vacuole rupture.
Figures
Figure 1
A series of images of a TE that was undergoing vacuole rupture (a–f). This TE was stained with SYTO16 and FDA (a–e). The red autofluorescence of the chloroplasts was merged. a, The green fluorescence of SYTO16 and fluorescein could be observed in the nucleus and cytoplasm (7 min before vacuole rupture). The TE was highly vacuolated and its nucleus was tightly pressed against the plasma membrane. b, Soon after vacuole rupture (0 min), the nucleus was released from the vacuolar turgor pressure and became spherical. The heterochromatin structure could be seen just inside the nucleus. SYTO16 fluorescence in some chloroplasts appeared in this focal plane. The green fluorescence in the cytoplasm disappeared probably because the emission spectra of fluorescein changed following vacuole rupture (see “Discussion”). c, Nuclear fluorescence started decreasing from the central region (6 min after vacuole rupture). d, Nuclear fluorescence of SYTO16 decreased markedly in the central region (10 min after vacuole rupture). e, The fluorescence of SYTO16 disappeared almost completely, whereas the autofluorescence of the chloroplasts was still visible (18 min after vacuole rupture). f, The nuclear envelope could be seen in the light image of the TE even 20 min after vacuole rupture (arrow). The bar indicates 20 μm.
Figure 2
Serial fluorescence images of a TE stained with SYTO16 and FDA (a–e). Red autofluorescence of the chloroplasts was eliminated. a, The fluorescence in the nucleus and cytoplasm was evident in the TE 7 min before vacuole rupture. The TE was so vacuolated that its nucleus was pressed against the plasma membrane and flattened. Boundary between the cytoplasm and vacuole was definite. b, The boundary became obscure and fluorescence intensity in the cytoplasm decreased, whereas that in the vacuole increased (2 min before vacuole rupture). Note that the nucleus was still flattened. c, The nucleus was released from the vacuole turgor pressure soon after vacuole rupture (0 min). d, The fluorescence intensity in the nucleus decreased markedly in the central region (4 min after vacuole rupture). e, The fluorescence of SYTO16 disappeared almost completely (14 min after vacuole rupture). f, Secondary wall thickening had already been obvious even 22 min before vacuole rupture. The bar indicates 20 μm.
Figure 3
Images of cultured cells stained with FDA, SYTO16, and propidium iodide. Light (a, d, and g), fluorescein and SYTO16 (b, e, and h), and propidium iodide (c, f, and i) images of cells cultured for 60 h. The TE indicated by an arrow in a was magnified in d through f. The TE exhibited yellow fluorescence of fluorescein in the whole cell and no green fluorescence in the cytoplasm, indicating that the TE had just undergone vacuole rupture (Kuriyama, 1999). The dead non-TE cell indicated by an arrowhead in a was magnified in g through i. Note that propidium iodide did not stain the nucleus of the TE just after vacuole rupture (f) although it stained the nucleus of the dead non-TE (i). Bars indicate 10 μm.
Figure 4
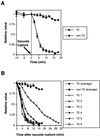
Changes in SYTO16 fluorescence intensity in the TE and non-TE nuclei. Fluorescence intensity was determined as the sum of pixel values per area of each organelle. The data are presented as relative values to actual pixel counts on the 0-min image. A, The pattern of changes in nuclear SYTO16 fluorescence intensity in TEs before and after vacuole rupture were compared with that in non-TEs observed in the same visual field. The SYTO16 fluorescence intensity of the TE nuclei decreased dramatically after vacuole rupture. B, The pattern of changes in nuclear fluorescence intensity in individual TEs after vacuole rupture. Five TEs exhibited the similarly the rapid decrease of their nuclear fluorescence following vacuole rupture (represented by TE 1–TE 5), although a TE degraded its nucleus relatively slowly (represented by TE 6). The values of closed square indicates the mean of five values (TE 1–TE 5) ±
se
. The values of closed lozenge indicates the mean of five non-TEs ±
se
.
Figure 5
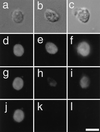
Images of DNA degradation in isolated nuclei. Differential interference contrast (a–c) and fluorescence (d–l) images of isolated nuclei are shown. Nuclei were stained with SYTO16 (d, e, g, h, j, and k) or DAPI (f, i, and l). Nuclei were treated with DNase I for 0 min (b, c, e, and f), 5 min (h and i), and 15 min (k and l). Images of the nucleus 0 min (a and d), 5 min (g), and 15 min (j) after mock treatment are also shown. Note that SYTO16 fluorescence after DNase I treatment declined similarly to DAPI fluorescence, a marker of DNA content, (e, f, h, i, k, and l), whereas SYTO16 fluorescence remained intensely without DNase I treatment (d, g, and j). The bar indicates 5 μm.
Figure 6
Changes in the intensity of nuclear SYTO16 fluorescence in non-TEs that have undergone probenecid-induced vacuole rupture. Because the timing of probenecid-induced vacuole rupture in non-TEs varied widely, non-TEs that had already undergone vacuole rupture and still exhibit intense nuclear SYTO16 fluorescence were chosen and analyzed (represented by non-TE 1–TE 5). The value of closed square indicates the mean of five living non-TEs that had the vacuole. Error bars represent
se
.
Figure 7
Fluorescence images of a TE that was undergoing vacuole rupture. The autofluorescence of the several chloroplasts was in focus. a, Nucleic acids in the nucleus, chloroplasts, and mitochondria could be observed in a TE 5 min before vacuole rupture. The nucleus was pressed against the plasma membrane by the large central vacuole. b, The nucleus was released from pressure soon after vacuole rupture (0 min). c, SYTO16 fluorescence in some chloroplasts disappeared within 4 min after vacuole rupture. d, Nucleic acids in the nucleus and chloroplasts were almost completely degraded, whereas chloroplast autofluorescence was still visible. The bar indicates 20 μm.
Figure 8
Changes in the intensity of nuclear SYTO16, chloroplast SYTO16, and chlorophyll fluorescence following vacuole rupture. The data are presented as relative values to actual pixel counts per area on the 0-min image. Error bars represent
se
.
Figure 9
Model for the description of autolytic process during TE differentiation. a, TEs are highly vacuolated before vacuole rupture. Cytoplasmic streaming continues to occur until this stage (Groover et al., 1997). b, The loss of tonoplast function occurs. However, the vacuole is not so immediately fragmented that it still presses the nucleus against the plasma membrane. c, Later, the nucleus becomes spherical. Nucleases (Thelen and Northcote, 1989; Ye and Droste, 1996; Aoyagi et al., 1998) attack nucleic acids. Cys proteases (Minami and Fukuda, 1995; Ye and Varner, 1996; Beers and Freeman 1997) degrade heterochromatin structure (data not shown) that can be seen just inside the nucleus. d, Degradation proceeds. e, DNA digestion precedes the breakdown of whole nuclear and chloroplast structure, which are still attached to the plasma membrane. f, TEs lose their contents and become mature. The wall at the tip becomes porous (Burgess and Linstead, 1984).
Similar articles
- Caspase inhibitors affect the kinetics and dimensions of tracheary elements in xylogenic Zinnia (Zinnia elegans) cell cultures.
Twumasi P, Iakimova ET, Qian T, van Ieperen W, Schel JH, Emons AM, van Kooten O, Woltering EJ. Twumasi P, et al. BMC Plant Biol. 2010 Aug 6;10:162. doi: 10.1186/1471-2229-10-162. BMC Plant Biol. 2010. PMID: 20691058 Free PMC article. - Loss of Tonoplast Integrity Programmed in Tracheary Element Differentiation.
Kuriyama H. Kuriyama H. Plant Physiol. 1999 Nov;121(3):763-774. doi: 10.1104/pp.121.3.763. Plant Physiol. 1999. PMID: 10557224 Free PMC article. - Xylogenesis in zinnia (Zinnia elegans) cell cultures: unravelling the regulatory steps in a complex developmental programmed cell death event.
Iakimova ET, Woltering EJ. Iakimova ET, et al. Planta. 2017 Apr;245(4):681-705. doi: 10.1007/s00425-017-2656-1. Epub 2017 Feb 13. Planta. 2017. PMID: 28194564 Free PMC article. Review. - Programmes of cell death and autolysis in tracheary elements: when a suicidal cell arranges its own corpse removal.
Escamez S, Tuominen H. Escamez S, et al. J Exp Bot. 2014 Mar;65(5):1313-21. doi: 10.1093/jxb/eru057. Epub 2014 Feb 19. J Exp Bot. 2014. PMID: 24554761 Review. - Programmed cell death of tracheary elements as a paradigm in plants.
Fukuda H. Fukuda H. Plant Mol Biol. 2000 Oct;44(3):245-53. doi: 10.1023/a:1026532223173. Plant Mol Biol. 2000. PMID: 11199386 Review.
Cited by
- Regulating programmed cell death in plant cells: Intracellular acidification plays a pivotal role together with calcium signaling.
Bosch M, Franklin-Tong V. Bosch M, et al. Plant Cell. 2024 Nov 2;36(11):4692-4702. doi: 10.1093/plcell/koae245. Plant Cell. 2024. PMID: 39197046 Free PMC article. Review. - Time course of programmed cell death, which included autophagic features, in hybrid tobacco cells expressing hybrid lethality.
Ueno N, Nihei S, Miyakawa N, Hirasawa T, Kanekatsu M, Marubashi W, van Doorn WG, Yamada T. Ueno N, et al. Plant Cell Rep. 2016 Dec;35(12):2475-2488. doi: 10.1007/s00299-016-2048-1. Epub 2016 Sep 1. Plant Cell Rep. 2016. PMID: 27585575 - The pathway of cell dismantling during programmed cell death in lace plant (Aponogeton madagascariensis) leaves.
Wertman J, Lord CE, Dauphinee AN, Gunawardena AH. Wertman J, et al. BMC Plant Biol. 2012 Jul 25;12:115. doi: 10.1186/1471-2229-12-115. BMC Plant Biol. 2012. PMID: 22828052 Free PMC article. - Programmed cell death and leaf morphogenesis in Monstera obliqua (Araceae).
Gunawardena AH, Sault K, Donnelly P, Greenwood JS, Dengler NG. Gunawardena AH, et al. Planta. 2005 Jul;221(5):607-18. doi: 10.1007/s00425-005-1545-1. Epub 2005 Jun 2. Planta. 2005. PMID: 15931501 - Caspase inhibitors affect the kinetics and dimensions of tracheary elements in xylogenic Zinnia (Zinnia elegans) cell cultures.
Twumasi P, Iakimova ET, Qian T, van Ieperen W, Schel JH, Emons AM, van Kooten O, Woltering EJ. Twumasi P, et al. BMC Plant Biol. 2010 Aug 6;10:162. doi: 10.1186/1471-2229-10-162. BMC Plant Biol. 2010. PMID: 20691058 Free PMC article.
References
- Aoyagi S, Sugiyama M, Fukuda H. BEN1 and ZEN1 cDNAs encoding S1-type DNases that are associated with programmed cell death in plants. FEBS Lett. 1998;429:134–138. - PubMed
- Bate NJ, Rothstein SJ, Thompson JE. Expression of nuclear and chloroplast photosynthesis-specific genes during leaf senescence. J Exp Bot. 1990;42:801–811.
- Burgess J, Linstead P. In vitro tracheary element formation: structural studies and the effect of triiodobenzoic acid. Planta. 1984;160:481–489. - PubMed
Publication types
MeSH terms
LinkOut - more resources
Full Text Sources


