Integrin-mediated adhesion regulates cell polarity and membrane protrusion through the Rho family of GTPases - PubMed (original) (raw)
Integrin-mediated adhesion regulates cell polarity and membrane protrusion through the Rho family of GTPases
E A Cox et al. Mol Biol Cell. 2001 Feb.
Free PMC article
Abstract
Integrin-mediated adhesion is a critical regulator of cell migration. Here we demonstrate that integrin-mediated adhesion to high fibronectin concentrations induces a stop signal for cell migration by inhibiting cell polarization and protrusion. On fibronectin, the stop signal is generated through alpha 5 beta 1 integrin-mediated signaling to the Rho family of GTPases. Specifically, Cdc42 and Rac1 activation exhibits a biphasic dependence on fibronectin concentration that parallels optimum cell polarization and protrusion. In contrast, RhoA activity increases with increasing substratum concentration. We find that cross talk between Cdc42 and Rac1 is required for substratum-stimulated protrusion, whereas RhoA activity is inhibitory. We also show that Cdc42 activity is inhibited by Rac1 activation, suggesting that Rac1 activity may down-regulate Cdc42 activity and promote the formation of stabilized rather than transient protrusion. Furthermore, expression of RhoA down-regulates Cdc42 and Rac1 activity, providing a mechanism whereby RhoA may inhibit cell polarization and protrusion. These findings implicate adhesion-dependent signaling as a mechanism to stop cell migration by regulating cell polarity and protrusion via the Rho family of GTPases.
Figures
Figure 1
Substratum concentration regulates the polarity of CHO cells (A–H) and neutrophils (I–J). Phase pictures (20×) of CHO cells plated on low (A and E), intermediate (B and F), high (C and G), and very high (D and H) concentrations of fibronectin. Cells were plated in CCMI (A–D) or serum-starved and plated in growth factor-free media (E–H, video sequences for these experiments are available online). Cells do not spread well and fail to polarize on low concentrations of fibronectin. Cells polarize well on intermediate concentrations, less on high concentrations, and only minimally on very high fibronectin concentrations. Note the reduction in cell spreading exhibited by serum-starved cells plated onto very high concentrations of fibronectin (H). Asterisks indicate cells on a high fibronectin concentration in CCMI, which exhibit inhibited tail release. Phase pictures (20×) of neutrophils plated on intermediate (I) and very high (J) concentrations of fibrinogen. Polarization and cell spreading are inhibited on very high concentrations of fibrinogen. Bar, 20 μm. Video sequences show serum-starved CHO cells plated on intermediate (Figure 1F.mov), high (Figure 1G.mov), or very high (Figure 1H.mov) concentrations of fibronectin. Video material is available at
.
Figure 2
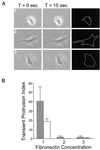
Substratum concentration regulates transient membrane protrusion in CHO cells. Quantitative analysis was performed to assay transient membrane protrusion in CHO cells. Cells were plated onto intermediate (1), high (2), and very high (3) concentrations of fibronectin for 2–4 h before analysis. (A) Examples of serum-starved cells used in transient membrane protrusion analysis (performed as described in MATERIALS AND METHODS). Images were taken at 15-s intervals for 5 min. Subsequent images were overlaid and pixels undergoing a change in gray level value of 5% or more were scored as positive (white pixels on black background in far right column). This was done for all images in the stack and results were quantified as described in MATERIALS AND METHODS. (B) Summarized results from three experiments using transient membrane protrusion analysis. Gray bars represent data from cells plated in CCMI and white bars represent data from serum-starved cells plated in serum-free media. The transient protrusion index is the average number of pixels per cell undergoing a 5% or more change in gray level value per 15-s interval. Data are the average of three experiments and error bars represent the SD. Transient membrane protrusion is maximal at an intermediate fibronectin concentration and reduced on higher concentrations.
Figure 3
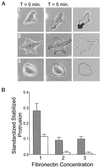
Substratum concentration regulates stabilized membrane protrusion in CHO cells. Quantitative analysis was performed to assay stabilized membrane protrusion in CHO cells. Cells were plated onto intermediate (1), high (2), and very high (3) concentrations of fibronectin for 2–4 h before analysis. (A) Examples of serum-starved cells used in stabilized membrane protrusion analysis (performed as described in MATERIALS AND METHODS). Images were taken at 5-min intervals for 1 h. Subsequent images were overlaid and the area of protrusion (shaded in far right column) was calculated and normalized to the total cell area. This was done for all images in the stack and results were quantified as described in MATERIALS AND METHODS. (B) Summarized results from three experiments using stabilized membrane protrusion analysis. Gray bars represent data from cells plated in CCMI and white bars represent data from serum-starved cells plated in serum-free media. Standardized stabilized protrusion is the average area of protrusion normalized to the total cell area per cell per 5-min interval. Data are the average of three experiments and error bars represent the SD. Stabilized membrane protrusion is maximal at an intermediate fibronectin concentration and reduced on higher concentrations.
Figure 4
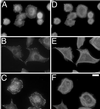
Substratum concentration regulates focal adhesion morphology in serum-starved CHO cells. Cells (60×) were plated for 3 h on silanated glass coverslips coated with intermediate (A and D), high (B and E), and very high (C and F) fibronectin concentrations and stained for vinculin (A–C) and actin (D–F). On higher substratum concentrations, cells form stronger, more centrally located adhesions and stress fibers. Bar, 20 μm.
Figure 5
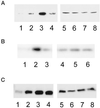
Cdc42 and Rac1 activation exhibit a biphasic dependence on substrate concentration, whereas RhoA activation increases with increasing substratum concentration. (A) Representative blot showing that Cdc42 activation is optimal at an intermediate fibronectin concentration. Serum-starved CHO cells were kept in suspension (1 and 5) or plated onto low (2 and 6), intermediate (3 and 7), or very high (4 and 8) concentrations of fibronectin for 3 h and activity assays were performed as described in MATERIALS AND METHODS. Affinity-precipitated Cdc42-GTP was run in lanes 1–4 and total cell lysate was run in lanes 5–8. (B) Representative blot showing that Rac1 activation is optimal at an intermediate fibronectin concentration. Serum-starved CHO cells were plated onto low (1 and 4), intermediate (2 and 5), or very high (3 and 6) concentrations of fibronectin for 3 h and activity assays were performed as described in MATERIALS AND METHODS. Affinity-precipitated Rac1-GTP was run in lanes 1–3 and total cell lysate was run in lanes 4–6. (C) Representative blot showing that RhoA activation increases with increasing fibronectin concentration. Serum-starved CHO cells were kept in suspension (1 and 5) or plated onto low (2 and 6), intermediate (3 and 7), or very high (4 and 8) concentrations of fibronectin for 3 h and activity assays were performed as described in MATERIALS AND METHODS. Affinity-precipitated RhoA-GTP was run in lanes 1–4 and the total cell lysate was run in lanes 5–8.
Figure 6
Cross talk between Cdc42 and Rac1 is required for substratum-stimulated membrane activity, whereas RhoA activity is inhibitory. (A and B) CHO cells were transfected with control vector, or vectors expressing N17Cdc42 (dominant negative Cdc42), N17Rac1 (dominant negative Rac1), or wild-type RhoA. Analysis was performed using serum-starved cells 2–4 h after plating on an intermediate concentration of fibronectin. (A) Summarized results from three experiments using transient membrane protrusion analysis. The transient protrusion index was determined for the control and standardized to 100. The transient protrusion index for other conditions was determined as a percentage of control with the error bars representing the SD. (B) Histogram showing results from three experiments using stabilized membrane protrusion analysis. The standardized stabilized protrusion was determined for controls and standardized to 100. The relative standardized stabilized protrusion for other conditions was determined as a percentage of control with the error bars representing the SD. (C) Dominant negative Cdc42 inhibits the transient membrane activity stimulated by dominant negative Rac1. Cells were cotransfected in a 1:8 ratio with pIRES-EGFP-N17Rac and either pcDNA3.1 (control) or pEXV-N17Cdc42. Cotransfected cells were identified through fluorescence and transient membrane activity was quantified as described in MATERIALS AND METHODS. The transient protrusion index was determined for the control and standardized to 100. The transient protrusion index for cells cotransfected with N17Cdc42 was determined as a percentage of control with the error bars representing the SD.
Figure 7
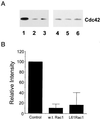
Rac1 down-regulates Cdc42 activity. (A) Representative blot showing that Cdc42 activity is inhibited in cells expressing wild-type and L61Rac1. Cells were transiently transfected with control vector (1 and 4), wild-type Rac1 (2 and 5), or L61Rac1 (3 and 6) (constitutively active), and Cdc42 activity assays were performed as described in MATERIALS AND METHODS. Affinity-precipitated Cdc42-6TP was run in lanes 1–3, and total cell lysate was run in lanes 4–6. (B) Results from densitometry analysis of three experiments. The signal obtained for cells transfected with control vector was assigned a relative intensity of 100. For other samples, the intensity of signal was determined as a percentage of control. Error bars represent the SD.
Figure 8
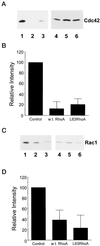
RhoA down-regulates Cdc42 and Rac1 activity. Cells were transiently transfected with either control vector, wild-type RhoA, or L63RhoA (constitutively active), and Cdc42/Rac1 activity assays were performed as described in MATERIALS AND METHODS. (A and C) Representative blots showing that Cdc42 (A) and Rac1 (C) activity are reduced in CHO cells that express wild-type and L63RhoA. Cells were transfected with control vector (1 and 4), wild-type RhoA (2 and 5), or L63RhoA (3 and 6) and plated onto an intermediate fibronectin-coating concentration. Affinity-precipitated Cdc42-GTP or Rac1-GTP was run in lanes 1–3 and total cell lysate was run in lanes 4–6. (B and D) Results from densitometry analysis of three experiments from the Cdc42 (B) and Rac (D) activity assays. The signal obtained for cells transfected with control vector was assigned a relative intensity of 100. For other samples, the intensity of signal was determined as a percentage of control. Error bars represent the SD.
Figure 9
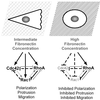
Schematic to demonstrate how integrin-mediated signaling on different substratum concentrations regulates cell polarity and protrusion via the Rho family GTPases. This model also highlights proposed cross talk interactions that may occur between Cdc42, Rac1, and RhoA. On intermediate fibronectin concentrations integrin-mediated signaling activates Cdc42, Rac1, and RhoA, resulting in cell polarization, protrusion, and migration. On higher fibronectin concentrations, integrin-mediated signaling inhibits Cdc42 and Rac1 activity but stimulates RhoA activity. This results in loss of cell polarity, inhibited protrusion, and inhibited migration. On all substratum concentrations, cross talk between the Rho family of GTPases is likely to influence protrusive activity. Solid black lines indicate interactions that have been documented both here and in other recent articles. Specifically, integrin-mediated signaling has been shown to activate Cdc42, Rac1, and RhoA (Barry et al., 1997; Clark et al., 1998; Price et al., 1998; Ren et al., 1999; del Pozo et al., 2000); and an antagonistic relationship has been proposed between RhoA and Rac1 (Rottner et al., 1999). Dotted black lines indicate new interactions that have been documented in this article. Specifically, we find that Rac1 and RhoA can inhibit Cdc42 activity. Gray lines indicate interactions that have been proposed in previous publications. For example, several recent studies have demonstrated that Cdc42 and Rac1 can inhibit RhoA activity (van Leeuwen et al., 1997; Sander et al., 1999; Zondag et al., 2000).
Similar articles
- The Rho family of small GTPases is involved in epithelial cystogenesis and tubulogenesis.
Rogers KK, Jou TS, Guo W, Lipschutz JH. Rogers KK, et al. Kidney Int. 2003 May;63(5):1632-44. doi: 10.1046/j.1523-1755.2003.00902.x. Kidney Int. 2003. PMID: 12675838 - Rho GTPases control migration and polarization of adhesion molecules and cytoskeletal ERM components in T lymphocytes.
del Pozo MA, Vicente-Manzanares M, Tejedor R, Serrador JM, Sánchez-Madrid F. del Pozo MA, et al. Eur J Immunol. 1999 Nov;29(11):3609-20. doi: 10.1002/(SICI)1521-4141(199911)29:11<3609::AID-IMMU3609>3.0.CO;2-S. Eur J Immunol. 1999. PMID: 10556816 - Vav2 activates Rac1, Cdc42, and RhoA downstream from growth factor receptors but not beta1 integrins.
Liu BP, Burridge K. Liu BP, et al. Mol Cell Biol. 2000 Oct;20(19):7160-9. doi: 10.1128/MCB.20.19.7160-7169.2000. Mol Cell Biol. 2000. PMID: 10982832 Free PMC article. - Regulation of Rho family GTPases by cell-cell and cell-matrix adhesion.
Arthur WT, Noren NK, Burridge K. Arthur WT, et al. Biol Res. 2002;35(2):239-46. doi: 10.4067/s0716-97602002000200016. Biol Res. 2002. PMID: 12415742 Review. - Rac1 and RhoA: Networks, loops and bistability.
Nguyen LK, Kholodenko BN, von Kriegsheim A. Nguyen LK, et al. Small GTPases. 2018 Jul 4;9(4):316-321. doi: 10.1080/21541248.2016.1224399. Epub 2016 Sep 10. Small GTPases. 2018. PMID: 27533896 Free PMC article. Review.
Cited by
- Calpain regulates neutrophil chemotaxis.
Lokuta MA, Nuzzi PA, Huttenlocher A. Lokuta MA, et al. Proc Natl Acad Sci U S A. 2003 Apr 1;100(7):4006-11. doi: 10.1073/pnas.0636533100. Epub 2003 Mar 20. Proc Natl Acad Sci U S A. 2003. PMID: 12649322 Free PMC article. - p27Kip1 modulates cell migration through the regulation of RhoA activation.
Besson A, Gurian-West M, Schmidt A, Hall A, Roberts JM. Besson A, et al. Genes Dev. 2004 Apr 15;18(8):862-76. doi: 10.1101/gad.1185504. Epub 2004 Apr 12. Genes Dev. 2004. PMID: 15078817 Free PMC article. - Smurf1 regulates tumor cell plasticity and motility through degradation of RhoA leading to localized inhibition of contractility.
Sahai E, Garcia-Medina R, Pouysségur J, Vial E. Sahai E, et al. J Cell Biol. 2007 Jan 1;176(1):35-42. doi: 10.1083/jcb.200605135. Epub 2006 Dec 26. J Cell Biol. 2007. PMID: 17190792 Free PMC article. - Who's got pull around here? Cell organization in development and tissue engineering.
Lauffenburger DA, Griffith LG. Lauffenburger DA, et al. Proc Natl Acad Sci U S A. 2001 Apr 10;98(8):4282-4. doi: 10.1073/pnas.081083698. Proc Natl Acad Sci U S A. 2001. PMID: 11296276 Free PMC article. No abstract available. - Cytoskeleton Response to Ionizing Radiation: A Brief Review on Adhesion and Migration Effects.
La Verde G, Artiola V, Panzetta V, Pugliese M, Netti PA, Fusco S. La Verde G, et al. Biomedicines. 2021 Aug 28;9(9):1102. doi: 10.3390/biomedicines9091102. Biomedicines. 2021. PMID: 34572287 Free PMC article. Review.
References
- Airola K, Johansson N, Kariniemi AL, Kahari VM, Saarialho-Kere UK. Human collagenase-3 is expressed in malignant squamous epithelium of the skin. J Invest Dermatol. 1997;109:225–231. - PubMed
- Anand-Apte B, Zetter BR, Viswanathan A, Qiu RG, Chen J, Ruggieri R, Symons M. Platelet-derived growth factor and fibronectin-stimulated migration are differentially regulated by the Rac and extracellular signal-regulated kinase pathways. J Biol Chem. 1997;272:30688–30692. - PubMed
- Asthagiri AR, Nelson CM, Horwitz AF, Lauffenburger DA. Quantitative relationship among integrin-ligand binding, adhesion, and signaling via focal adhesion kinase and extracellular signal-regulated kinase 2. J Biol Chem. 1999;274:27119–27127. - PubMed
Publication types
MeSH terms
Substances
LinkOut - more resources
Full Text Sources
Other Literature Sources
Research Materials
Miscellaneous

