Comparative DNA sequence analysis of mouse and human protocadherin gene clusters - PubMed (original) (raw)
Comparative Study
. 2001 Mar;11(3):389-404.
doi: 10.1101/gr.167301.
Affiliations
- PMID: 11230163
- PMCID: PMC311048
- DOI: 10.1101/gr.167301
Comparative Study
Comparative DNA sequence analysis of mouse and human protocadherin gene clusters
Q Wu et al. Genome Res. 2001 Mar.
Abstract
The genomic organization of the human protocadherin alpha, beta, and gamma gene clusters (designated Pcdh alpha [gene symbol PCDHA], Pcdh beta [PCDHB], and Pcdh gamma [PCDHG]) is remarkably similar to that of immunoglobulin and T-cell receptor genes. The extracellular and transmembrane domains of each protocadherin protein are encoded by an unusually large "variable" region exon, while the intracellular domains are encoded by three small "constant" region exons located downstream from a tandem array of variable region exons. Here we report the results of a comparative DNA sequence analysis of the orthologous human (750 kb) and mouse (900 kb) protocadherin gene clusters. The organization of Pcdh alpha and Pcdh gamma gene clusters in the two species is virtually identical, whereas the mouse Pcdh beta gene cluster is larger and contains more genes than the human Pcdh beta gene cluster. We identified conserved DNA sequences upstream of the variable region exons, and found that these sequences are more conserved between orthologs than between paralogs. Within this region, there is a highly conserved DNA sequence motif located at about the same position upstream of the translation start codon of each variable region exon. In addition, the variable region of each gene cluster contains a rich array of CpG islands, whose location corresponds to the position of each variable region exon. These observations are consistent with the proposal that the expression of each variable region exon is regulated by a distinct promoter, which is highly conserved between orthologous variable region exons in mouse and human.
Figures
Figure 1
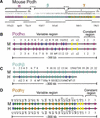
Comparison of the organization of mouse and human protocadherin gene clusters. Shown are the genomic organization of three closely linked mouse protocadherin gene clusters (A) and comparisons of the genomic organization of mouse and human _Pcdh_α/CNR (B), _Pcdh_β (C), and _Pcdh_γ (D) gene clusters. The BAC clones used in the sequence analysis are shown below (A). The length of sequences between clusters is also shown in (A). Each gene family contains multiple tandem variable region exons indicated by a vertical color bar: (mauve) Pcdhα variable region exons; (turquoise) Pcdhβ genes; (orange) _Pcdh_γ-b variable region exons; (green) _Pcdh_γ-a variable region exons; (yellow) C-type Pcdh variable region exons (present in both the _Pcdh_α and _Pcdh_γ gene clusters); (blue) relic or pseudogene variable region sequences (present in all three gene clusters); (pink) constant region exons. Abbreviations: Pcdh, protocadherin; V, variable region; C, constant region; M, mouse; H, human; r, relic; Θ, pseudogene.
Figure 2
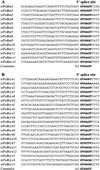
Alignments of variable region 5′ splice sites of mouse _Pcdh_α (A) and _Pcdh_γ (B) gene clusters. The 5′ splice site sequences are shown in bold, with the consensus below each panel.
Figure 3
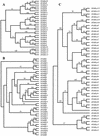
Phylogenetic trees of human and mouse _Pcdh_α (A), _Pcdh_β (B), and _Pcdh_γ (C) gene clusters. The trees were reconstructed using the neighbor-joining method of the
PAUP
program. The tree branches are labeled with the percentage support for that partition based on 1000 bootstrap replicates. Only bootstrap values of >50% are shown. The unrooted trees are rooted by midpoint prior to output.
Figure 4
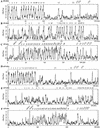
Distribution of CpG islands in the genomic sequences of human and mouse protocadherin gene clusters. Shown are ratios of observed to expected CpG dinucleotide frequency of a 1000 bp sliding window in the region of human _Pcdh_α (A), _Pcdh_β (B), and _Pcdh_γ (C) and mouse _Pcdh_α (D), _Pcdh_β (E), and _Pcdh_γ (F) gene clusters. The peak of ratios correlates with the position of protocadherin variable region exons but not constant region exons. The position of each variable and constant region exon is indicated at the top of each panel. (CT), constant region exon.
Figure 5
Percent identity plot (PIP) of the _Pcdh_α (A) and _Pcdh_γ (B) genomic sequences between mouse and human by using the
PipMaker
program with the chaining option. The mouse genomic sequences are shown on the _x_-axis, and the percentage sequence identities (50%–100%) are shown on the _y_-axis. Annotation of the mouse sequences is illustrated at the top of the sequences by solid color boxes. The repeats of mouse sequence are depicted as follows: (black pointed boxes) LINE2s; (light gray pointed boxes) LINE1s; (dark gray pointed boxes) LTRs; (black triangles) MIRs; (light gray triangles) SINEs other than MIRs; (dark gray triangles) other repeats; (white boxes) simple repeats. Short yellow boxes are CpG islands where the ratio of CpG/GpC exceeds 0.75, and short green boxes are CpG islands where the ratio of CpG/GpC is between 0.60 and 0.75. (MDIA1) the last exon of mouse diaphanous gene 1.
Figure 6
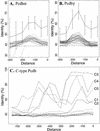
Upstream sequences of orthologous genes are more conserved than paralogous genes. The maximal sequence identities of all 100-bp segments within a 150-bp sliding window were computed for each gene pair. The _x_-axis represents the end position of the sliding window relative to the translation-start codon. The _y_-axis represents the percentage sequence identities. Shown are the average of 100-bp-segment maximal identities of all orthologous (solid lines with standard deviation) gene pairs in _Pcdh_α (A) and _Pcdh_γ (B) gene clusters. Also shown are the maximal identities between each gene and all the other paralogous members (excluding C-type protocadherin genes) of the same gene cluster (broken lines without standard deviation). The maximal identities for each orthologous gene pair in C-type protocadherin genes are shown individually in C. Note that the conserved region upstream of C-type protocadherin genes is larger than that of other protocadherin genes.
Figure 7
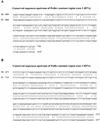
Conserved sequences upstream from constant region exon 1 of _Pcdh_α (A) and _Pcdh_γ (B) gene clusters. The identical nucleotides are shown by short vertical lines. The relative positions to the start nucleotide of constant region exon 1 are shown at the beginning and end of each sequence.
Figure 8
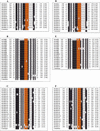
Alignment of conserved sequence motif upstream of protocadherin coding region. Shown are the conserved sequences and their relative positions to the translation start codon in mouse _Pcdh_α (A), _Pcdh_β (B), and _Pcdh_γ (C) and human _Pcdh_α (D), _Pcdh_β (E), and _Pcdh_γ (F) gene clusters. The probability of finding the motif within -290 to -150 nucleotides upstream of the translation start codon is shown within parentheses at right. The consensus sequences are shown below each panel. The conserved nucleotides are shown with white letters on a black background. The core sequences are highlighted with yellow bold letters on a red background.
Similar articles
- Genomic organization and transcripts of the zebrafish Protocadherin genes.
Tada MN, Senzaki K, Tai Y, Morishita H, Tanaka YZ, Murata Y, Ishii Y, Asakawa S, Shimizu N, Sugino H, Yagi T. Tada MN, et al. Gene. 2004 Oct 13;340(2):197-211. doi: 10.1016/j.gene.2004.07.014. Gene. 2004. PMID: 15475161 - Identification and characterization of coding single-nucleotide polymorphisms within human protocadherin-alpha and -beta gene clusters.
Miki R, Hattori K, Taguchi Y, Tada MN, Isosaka T, Hidaka Y, Hirabayashi T, Hashimoto R, Fukuzako H, Yagi T. Miki R, et al. Gene. 2005 Apr 11;349:1-14. doi: 10.1016/j.gene.2004.11.044. Gene. 2005. PMID: 15777644 - Molecular evolution of cadherin-related neuronal receptor/protocadherin(alpha) (CNR/Pcdh(alpha)) gene cluster in Mus musculus subspecies.
Taguchi Y, Koide T, Shiroishi T, Yagi T. Taguchi Y, et al. Mol Biol Evol. 2005 Jun;22(6):1433-43. doi: 10.1093/molbev/msi130. Epub 2005 Mar 9. Mol Biol Evol. 2005. PMID: 15758202 - The role and expression of the protocadherin-alpha clusters in the CNS.
Hirayama T, Yagi T. Hirayama T, et al. Curr Opin Neurobiol. 2006 Jun;16(3):336-42. doi: 10.1016/j.conb.2006.05.003. Epub 2006 May 11. Curr Opin Neurobiol. 2006. PMID: 16697637 Review. - Clustered protocadherin family.
Yagi T. Yagi T. Dev Growth Differ. 2008 Jun;50 Suppl 1:S131-40. doi: 10.1111/j.1440-169X.2008.00991.x. Epub 2008 Apr 22. Dev Growth Differ. 2008. PMID: 18430161 Review.
Cited by
- Cadherin-based transsynaptic networks in establishing and modifying neural connectivity.
Friedman LG, Benson DL, Huntley GW. Friedman LG, et al. Curr Top Dev Biol. 2015;112:415-65. doi: 10.1016/bs.ctdb.2014.11.025. Epub 2015 Feb 11. Curr Top Dev Biol. 2015. PMID: 25733148 Free PMC article. Review. - Postnatal development- and age-related changes in DNA-methylation patterns in the human genome.
Salpea P, Russanova VR, Hirai TH, Sourlingas TG, Sekeri-Pataryas KE, Romero R, Epstein J, Howard BH. Salpea P, et al. Nucleic Acids Res. 2012 Aug;40(14):6477-94. doi: 10.1093/nar/gks312. Epub 2012 Apr 11. Nucleic Acids Res. 2012. PMID: 22495928 Free PMC article. - The role of clustered protocadherins in neurodevelopment and neuropsychiatric diseases.
Flaherty E, Maniatis T. Flaherty E, et al. Curr Opin Genet Dev. 2020 Dec;65:144-150. doi: 10.1016/j.gde.2020.05.041. Epub 2020 Jul 14. Curr Opin Genet Dev. 2020. PMID: 32679536 Free PMC article. Review. - Identification of CTCF as a master regulator of the clustered protocadherin genes.
Golan-Mashiach M, Grunspan M, Emmanuel R, Gibbs-Bar L, Dikstein R, Shapiro E. Golan-Mashiach M, et al. Nucleic Acids Res. 2012 Apr;40(8):3378-91. doi: 10.1093/nar/gkr1260. Epub 2011 Dec 30. Nucleic Acids Res. 2012. PMID: 22210889 Free PMC article. - Increasing the specificity of neurotrophic factors.
Chao MV. Chao MV. Proc Natl Acad Sci U S A. 2010 Aug 3;107(31):13565-6. doi: 10.1073/pnas.1008518107. Epub 2010 Jul 23. Proc Natl Acad Sci U S A. 2010. PMID: 20656936 Free PMC article. No abstract available.
References
- Ansari-Lari MA, Oeltjen JC, Schwartz S, Zhang Z, Muzny DM, Lu J, Gorrell JH, Chinault AC, Belmont JW, Miller W, et al. Comparative sequence analysis of a gene-rich cluster at human chromosome 12p13 and its syntenic region in mouse chromosome 6. Genome Res. 1998;8:29–40. - PubMed
- Bruses JL. Cadherin-mediated adhesion at the interneuronal synapse. Curr Opin Cell Biol. 2000;12:593–597. - PubMed
- Camacho JA, Obie C, Biery B, Goodman BK, Hu CA, Almashanu S, Steel G, Casey R, Lambert M, Mitchell GA, et al. Hyperornithinaemia-hyperammonaemia-homocitrullinuria syndrome is caused by mutations in a gene encoding a mitochondrial ornithine transporter. Nat Genet. 1999;22:151–158. - PubMed
Publication types
MeSH terms
Substances
LinkOut - more resources
Full Text Sources
Other Literature Sources
Molecular Biology Databases
