Ataxia telangiectasia mutated is essential during adult neurogenesis - PubMed (original) (raw)
. 2001 Mar 1;15(5):554-66.
doi: 10.1101/gad.869001.
H van Praag, J Ray, Z Weaver, C J Winrow, T A Carter, R Braquet, E Harrington, T Ried, K D Brown, F H Gage, C Barlow
Affiliations
- PMID: 11238376
- PMCID: PMC312645
- DOI: 10.1101/gad.869001
Ataxia telangiectasia mutated is essential during adult neurogenesis
D M Allen et al. Genes Dev. 2001.
Abstract
Ataxia telangiectasia (A-T) is an autosomal recessive disease characterized by normal brain development followed by progressive neurodegeneration. The gene mutated in A-T (ATM) is a serine protein kinase implicated in cell cycle regulation and DNA repair. The role of ATM in the brain and the consequences of its loss on neuronal survival remain unclear. We studied the role of ATM in adult neural progenitor cells in vivo and in vitro to define the role of ATM in dividing and postmitotic neural cells from Atm-deficient (Atm(-/-)) mice in a physiologic context. We demonstrate that ATM is an abundant protein in dividing neural progenitor cells but is markedly down-regulated as cells differentiate. In the absence of ATM, neural progenitor cells of the dentate gyrus show abnormally high rates of proliferation and genomic instability. Atm(-/-) cells in vivo, and in cell culture, show a blunted response to environmental stimuli that promote neural progenitor cell proliferation, survival, and differentiation along a neuronal lineage. This study defines a role for ATM during the process of neurogenesis, demonstrates that ATM is required for normal cell fate determination and neuronal survival both in vitro and in vivo, and points to a mechanism for neuronal cell loss in progressive neurodegenerative diseases.
Figures
Figure 1
Proliferation and survival of neural progenitor cells in wild-type and _Atm_−/− dentate gyrus. (A) Correlation between average running in wheel revolutions and total number of proliferating cells in wild-type (green) and _Atm_−/− (blue) mice. The x-axis indicates the average amount of running measured in revolutions per day; the y-axis represents the total number of proliferating cells per granule cell layer corrected for volume. Open colored circles to the left of the dotted vertical line indicate animals with no wheel (green, wild type; blue, _Atm_−/−). Increased running resulted in less proliferation in _Atm_−/− (blue-filled circles and blue line, _r_2 = 0.57) mice than wild-type mice (green-filled circles and green line, _r_2 = 0.62). Arrowheads indicate _Atm_−/− animals with cellular proliferation at baseline similar to the amount found in _Atm_−/− mice running more than 3000 revolutions per day (arrows). (B) Correlation between average running and total number of surviving cells in wild-type (green) and _Atm_−/− (blue) mice. The x-axis indicates the average amount of running measured in revolutions per day; the y-axis is the total number of surviving cells per granule cell layer, unfilled circles and dotted vertical line indicate animals with no wheel. Increased running resulted in a substantial and linear increase in cell survival in wild-type mice (green-filled circles and green line, _r_2 = 0.96). There is a less robust increase in survival in _Atm_−/− mice in response to a similar amount of running (blue-filled circles and blue line, _r_2 = 0.72). Arrowhead over green-filled circle indicates a wild-type animal that had the same amount of survival as an _Atm_−/− animal that ran more than twice the amount (arrow pointing to blue-filled circle). (C) The percent increase in cell proliferation in wild-type animals (WT, green) is significantly greater than that in _Atm_−/− mice (_Atm_−/− blue). The x-axis indicates genotype (WT, wild type; _Atm_−/−, mutants). The y-axis indicates the percent increase in cells that proliferate in response to running. ***P < 0.0001 using a χ2 test. (D) The percent increase in cell survival in wild-type animals (WT, green) is significantly greater than that in _Atm_−/− mice (_Atm_−/−, blue). The x-axis indicates genotype (WT, wild type; _Atm_−/−, mutants). The y-axis indicates the percent increase in cells that survive in response to running. ***P < 0.001 using a χ2 test.
Figure 2
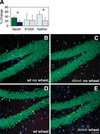
_Atm_−/− mice do not show a similar increase in the number of neurons that differentiate and survive in response to running as wild-type mice. (A) The percentage increase (solid bars) or decrease (hatched bars) in BrdU-positive cells that stained for the neuronal marker NeuN or the glial marker S100β or were marker negative (neither) in wild-type (wt, green) and _Atm_−/− (blue) animals. (B–E) Representative dentate gyrus sections from (B, wt no wheel) wild-type and (_C, Atm_−/− no wheel) _Atm_−/− mice in the absence of running wheels and (D, wt wheel) wild-type and (E, _Atm_−/− wheel) _Atm_−/− mice with running wheels. Green staining represents NeuN, blue staining represents S100β, red staining indicates BrdU (arrowhead). Colabeling of BrdU and NeuN is orange (arrow) and colabeling with S100β and BrdU is pink (*) (*P < 0.01 using a χ2 test).
Figure 3
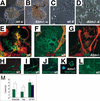
Lack of normal differentiation in _Atm_−/− neural progenitor preparations. Baseline morphology and differentiation of wild-type and _Atm_−/− neural progenitor cells. Undifferentiated cells have a similar morphology in both wild-type (A, wt u) and _Atm_−/− (B, _Atm_−/− u) cells. With stimulation to differentiate, wild-type (C, wt d) cells flatten out and extend processes (arrows), whereas _Atm_−/− cells (_D, Atm_−/− d) flatten out and cease dividing but do not extend processes. Immunohistochemistry using RIP to detect oligodendrocytes (green) and glial fibrilary acidic protein (GFAP) to detect astrocytes (red) in differentiated wild-type (E,F, wt) and _Atm_−/− (_G, Atm_−/−) progenitor preparations. Note that only wild-type (E,F) cells show RIP staining, whereas astrocytes were detected in both genotypes (wild type, E,F; _Atm_−/−, G), Map2ab staining of differentiated neurons in wild-type (H–J, wt) mice preparations. No normal-appearing neurons were found in _Atm_−/− preparations, although rare cells that stained for Map2ab but did not extend normal processes were detected (_K, Atm_−/− and blue indicates DAPI staining). TUJ1-positive cells were readily identified in wild-type (L, wt) but not in _Atm_−/− cultures. (M) Bar graph depicting the number of cells per high power field (y-axis, cells/hpf) that stained for Map2ab, RIP, or GFAP in wild-type (green) and _Atm_−/− (blue) mice. *P < 0.03 using a Student's t test.
Figure 4
Genomic instability in _Atm_−/− neural progenitor cells. Representative spectral karyotype demonstrating nonclonal chromosomal rearrangements in the absence of ATM in proliferating neural progenitor cells. (A–C) Spectral karyotyping analysis of a representative metaphase, 41XY, T(4;18), and T(18;4), +15, shown in hybridization display colors (A) next to the inverted DAPI-banded image (B). Arrows indicate the reciprocal translocation breakpoints, and arrowheads indicate the three copies of chromosome 15. The fully classified metaphase is shown in C. Each chromosome is shown in display colors next to the spectra-based classification pseudocolors. (D–F) FISH using a 5′ specific probe to the CNR locus. The CNR 5′ probe is displayed in red in D and the 3′-specific probe is shown in yellow in E. An overlay including the paint of chromosome 18 (green) in F demonstrates no rearrangement within this locus.
Figure 5
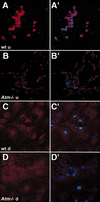
ATM is abundant in dividing neural progenitors. Neural progenitor cells were isolated from the brains of wild-type (wt) or _Atm_−/− mice as outlined in Materials and Methods. Cultures of these cells were fixed and stained with the ATM antisera pAb 855m and counterstained with DAPI to reveal the DNA. Images A–D are the pAb 855m staining alone, whereas images A‘–D‘ are merged images showing both the pAb 855m and DAPI staining. (A,A‘) Undifferentiated wild-type (wt u) neural progenitor cells. (B,B‘) Undifferentiated _Atm_−/− (_Atm_−/− u) neural progenitor cells. (C,C‘) Neural progenitors from wild-type brain after differentiation (wt d) by addition of retinoic acid and serum. (D,D‘) Neural progenitors from _Atm_−/− brain after treatment with retinoic acid and serum (_Atm_−/− d). Note the strong staining present in the wild-type undifferentiated neural progenitors but that this staining is absent from both the differentiated wild-type cells and the _Atm_-deficient cells. Furthermore, note that the observed pAb 855m staining (red) in A‘ extends beyond the DAPI staining (blue) nucleus, suggesting that a pool of ATM exists within the cytoplasm of these cells.
Figure 6
ATM is present in both the nuclear and cytoplasmic compartments of neural progenitors and is quantitatively lost during differentiation in vitro. (A) SDS extracts were formed from cultures of wild-type undifferentiated (wt u), wild-type differentiated (wt d), and _Atm_−/− neural progenitors (_Atm_−/−) and 100 μg of total protein from each extract was subjected to immunoblot analysis. Note the robust ATM immunoreactivity present in the wild-type undifferentiated extract, the slight band present in the extract from wild-type differentiated cells, and the lack of immunoreactivity in _Atm_−/− cells. (B) Undifferentiated wild-type neural progenitors were subjected to subcellular fractionation and equal percentages (3%) of the resultant nuclear and cytoplasmic fractions were subjected to immunoblot analysis. Note the presence of ATM in both the nuclear and cytoplasmic fractions.
Figure 7
Comparison of ATM function in catastrophic and normal physiological contexts. Shown is a comparison of the presumptive role of ATM in the early events (proliferation) and late events (cell fate determination and survival) of neurogenesis. In response to catastrophic DNA damage (either ionizing radiation or absence of DNA ligase IV/XRCC4) (left), neural stem cells (NS) proliferate but neural progenitors (NP) and lineage-restricted precursors (RP) undergo programmed cell death. The cell death induced by massive DNA damage is dependent on ATM signaling to p53 to activate apoptosis. The absence of ATM or p53 rescues the cell death phenotype and the cells differentiate along all lineages and survive. Therefore, in the setting of catastrophic DNA damage, loss of ATM, results in enhanced survival of neural progenitors. In contrast, under normal physiological conditions (right), ATM is required to maintain appropriate cell cycle checkpoints at baseline and in response to growth cues and also contributes to maintaining genomic stability. An additional role for ATM in cell fate determination and survival is then apparent as these cells mature. In the absence of ATM, NP cells are able to proliferate but have a decreased ability to differentiate along a nonastrocytic lineage. In this setting, ATM is required for both the normal differentiation and survival of neurons and oligodendroctyes. Therefore, under physiologic conditions, the lack of ATM results in the decreased production and the diminished survival of neurons and oligodendroctyes.
Similar articles
- Ataxia telangiectasia mutated-dependent apoptosis after genotoxic stress in the developing nervous system is determined by cellular differentiation status.
Lee Y, Chong MJ, McKinnon PJ. Lee Y, et al. J Neurosci. 2001 Sep 1;21(17):6687-93. doi: 10.1523/JNEUROSCI.21-17-06687.2001. J Neurosci. 2001. PMID: 11517258 Free PMC article. - Loss of ATM impairs proliferation of neural stem cells through oxidative stress-mediated p38 MAPK signaling.
Kim J, Wong PK. Kim J, et al. Stem Cells. 2009 Aug;27(8):1987-98. doi: 10.1002/stem.125. Stem Cells. 2009. PMID: 19544430 - Ataxia telangiectasia: new neurons and ATM.
McKinnon PJ. McKinnon PJ. Trends Mol Med. 2001 Jun;7(6):233-4. doi: 10.1016/s1471-4914(01)02035-4. Trends Mol Med. 2001. PMID: 11378498 - Oxidative stress in ataxia telangiectasia.
Watters DJ. Watters DJ. Redox Rep. 2003;8(1):23-9. doi: 10.1179/135100003125001206. Redox Rep. 2003. PMID: 12631440 Review. - The ATM gene and ataxia telangiectasia.
Mavrou A, Tsangaris GT, Roma E, Kolialexi A. Mavrou A, et al. Anticancer Res. 2008 Jan-Feb;28(1B):401-5. Anticancer Res. 2008. PMID: 18383876 Review.
Cited by
- Molecular Mechanisms of IL18 in Disease.
Yamanishi K, Hata M, Gamachi N, Watanabe Y, Yamanishi C, Okamura H, Matsunaga H. Yamanishi K, et al. Int J Mol Sci. 2023 Dec 6;24(24):17170. doi: 10.3390/ijms242417170. Int J Mol Sci. 2023. PMID: 38139000 Free PMC article. Review. - Multiple Sclerosis and Aging: The Dynamics of Demyelination and Remyelination.
Correale J, Ysrraelit MC. Correale J, et al. ASN Neuro. 2022 Jan-Dec;14:17590914221118502. doi: 10.1177/17590914221118502. ASN Neuro. 2022. PMID: 35938615 Free PMC article. Review. - Neurogenesis in aging and age-related neurodegenerative diseases.
Culig L, Chu X, Bohr VA. Culig L, et al. Ageing Res Rev. 2022 Jun;78:101636. doi: 10.1016/j.arr.2022.101636. Epub 2022 Apr 29. Ageing Res Rev. 2022. PMID: 35490966 Free PMC article. Review. - Systems genetics in the rat HXB/BXH family identifies Tti2 as a pleiotropic quantitative trait gene for adult hippocampal neurogenesis and serum glucose.
Senko AN, Overall RW, Silhavy J, Mlejnek P, Malínská H, Hüttl M, Marková I, Fabel KS, Lu L, Stuchlik A, Williams RW, Pravenec M, Kempermann G. Senko AN, et al. PLoS Genet. 2022 Apr 4;18(4):e1009638. doi: 10.1371/journal.pgen.1009638. eCollection 2022 Apr. PLoS Genet. 2022. PMID: 35377872 Free PMC article. - Oxidative stress sensing and response in neural stem cell fate.
Hwang I, Tang D, Paik J. Hwang I, et al. Free Radic Biol Med. 2021 Jun;169:74-83. doi: 10.1016/j.freeradbiomed.2021.03.043. Epub 2021 Apr 18. Free Radic Biol Med. 2021. PMID: 33862161 Free PMC article.
References
- Barlow C, Hirotsune S, Paylor R, Liyanage M, Eckhaus M, Collins F, Shiloh Y, Crawley J, Ried T, Tagle D, et al. Atm deficient mice: A paradigm of ataxia-telangiectasia. Cell. 1996;86:159–171. - PubMed
- Barlow C, Brown K, Deng CX, Tagle D, Wynshaw-Boris A. Atm selectively regulates distinct p53-dependent cell cycle checkpoint and apoptotic pathways. Nature Genet. 1997;17:453–456. - PubMed
Publication types
MeSH terms
Substances
LinkOut - more resources
Full Text Sources
Other Literature Sources
Medical
Molecular Biology Databases
Research Materials
Miscellaneous


