Time courses of left and right amygdalar responses to fearful facial expressions - PubMed (original) (raw)
Time courses of left and right amygdalar responses to fearful facial expressions
M L Phillips et al. Hum Brain Mapp. 2001 Apr.
Abstract
Despite the many studies highlighting the role of the amygdala in fear perception, few have examined differences between right and left amygdalar responses. Using functional magnetic resonance imaging (fMRI), we examined neural responses in three groups of healthy volunteers (n = 18) to alternating blocks of fearful and neutral faces. Initial observation of extracted time series of both amygdalae to these stimuli indicated more rapid decreases of right than left amygdalar responses to fearful faces, and increasing magnitudes of right amygdalar responses to neutral faces with time. We compared right and left responses statistically by modeling each time series with (1) a stationary fit model (assuming a constant magnitude of amygdalar response to consecutive blocks of fearful faces) and (2) an adaptive model (no assumptions). Areas of significant sustained nonstationarity (time series points with significantly greater adaptive than stationary model fits) were demonstrated for both amygdalae. There was more significant nonstationarity of right than left amygdalar responses to neutral, and left than right amygdalar responses to fearful faces. These findings indicate significant variability over time of both right and left amygdalar responses to fearful and neutral facial expressions and are the first demonstration of specific differences in time courses of right and left amygdalar responses to these stimuli.
Copyright 2001 Wiley-Liss, Inc.
Figures
Figure 1
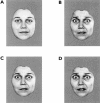
Examples of facial stimuli employed in the study. An expression of mild (25%) happiness is shown (A) and a prototypical (100%) expression of fear (B), in addition to expressions manipulated with morphing software to produce mild (75%; C) and intense (150%; D) fear.
Figure 2
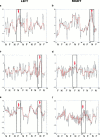
Examples of time series of left (a) and right (b) amygdalar responses of an illustrative subject in Group 1 during alternating presentation of 100% fearful and neutral facial expressions and performance of a sex decision task; left (c) and right (d) amygdalar responses of an illustrative subject in Group 2 during alternating presentation of 75% fearful and neutral facial expressions and performance of a sex decision task; and left (e) and right (f) amygdalar responses of an illustrative subject in Group 3 during alternating presentation of 100% fearful and neutral facial expressions and no task performance. Data were filtered (curve shown in orange) to suppress transient departures from stationarity which could be due to the presence of high‐frequency noise. The timing of presentation of stimuli (fear, F or neutral, N) is indicated for comparison with the individual time‐series. Labelling on the vertical axes on the time‐series plots refers to the change in signal or image intensity relative to the overall mean value (i.e, mean subtracted variation in signal in the amygdala). Labeling on the horizontal axes refer to the number of images acquired (20 images per 60‐sec period, and 100 images over each 5‐minute experiment). The maximal positive signal change in each amygdalar time series, occurring during presentation of either fearful or neutral faces, is indicated with an arrow.
Figure 3
(a) stationary and adaptive model fits (blue and red curves, respectively) in an illustrative subject from Group 1 of the left amygdalar time series (P = 0.009 and P = 0.02: significance of the stationary and adaptive model fits, respectively); (b) stationary and adaptive model fits (colours as above) of the right amygdalar time series of the above subject (P = 0.002 and P = 0.03: significance of the stationary and adaptive model fits, respectively). Curves smoothed with a median filter (over five data points) are shown in red indicating time points of the left (c) and right (d) amygdalar time series where the fit to the adaptive model was significantly greater than that of the stationary model (i.e., areas of significant and near‐significant nonstationarity: P = 0.1 and P = 0.005: for the left and right amygdala, respectively). The labeling on both axes is as for Figure 2. The maximal modeled positive signal change and the area of maximal sustained nonstationarity of response in each amygdalar time series, occurring during presentation of either fearful or neutral faces, is indicated with an arrow.
Figure 4
(a) stationary and adaptive model fits (blue and red curves, respectively) in an illustrative subject from Group 3 of the left amygdalar time series (P = 0.001 and P = 0.07: significance of the stationary and adaptive model fits, respectively); (b) stationary and adaptive model fits (colours as above) of the right amygdalar time series of the above subject (P = 0.03 and P = 0.6: significance of the stationary and adaptive model fits, respectively). Curves smoothed with a median filter (over five data points) are shown in red indicating time points of the left (c) and right (d) amygdalar time series where the fit to the adaptive model was significantly greater than that of the stationary model (i.e., areas of significant nonstationarity: P = 0.001 and P = 0.02: for the right and left amygdala, respectively). The labeling on both axes is as for Figure 2. The positioning of the arrows is as for Figure 3.
Similar articles
- An amygdala response to fearful faces with covered eyes.
Asghar AU, Chiu YC, Hallam G, Liu S, Mole H, Wright H, Young AW. Asghar AU, et al. Neuropsychologia. 2008;46(9):2364-70. doi: 10.1016/j.neuropsychologia.2008.03.015. Epub 2008 Apr 1. Neuropsychologia. 2008. PMID: 18479717 - Amygdalar activation associated with positive and negative facial expressions.
Yang TT, Menon V, Eliez S, Blasey C, White CD, Reid AJ, Gotlib IH, Reiss AL. Yang TT, et al. Neuroreport. 2002 Oct 7;13(14):1737-41. doi: 10.1097/00001756-200210070-00009. Neuroreport. 2002. PMID: 12395114 - Asymmetrical activation in the human brain during processing of fearful faces.
Noesselt T, Driver J, Heinze HJ, Dolan R. Noesselt T, et al. Curr Biol. 2005 Mar 8;15(5):424-9. doi: 10.1016/j.cub.2004.12.075. Curr Biol. 2005. PMID: 15753036 - Distributed and interactive brain mechanisms during emotion face perception: evidence from functional neuroimaging.
Vuilleumier P, Pourtois G. Vuilleumier P, et al. Neuropsychologia. 2007 Jan 7;45(1):174-94. doi: 10.1016/j.neuropsychologia.2006.06.003. Epub 2006 Jul 18. Neuropsychologia. 2007. PMID: 16854439 Review. - Seeing Fear: It's All in the Eyes?
Barrett LF. Barrett LF. Trends Neurosci. 2018 Sep;41(9):559-563. doi: 10.1016/j.tins.2018.06.009. Trends Neurosci. 2018. PMID: 30143181 Free PMC article. Review.
Cited by
- Subgenual Cingulum Microstructure Supports Control of Emotional Conflict.
Keedwell PA, Doidge AN, Meyer M, Lawrence N, Lawrence AD, Jones DK. Keedwell PA, et al. Cereb Cortex. 2016 Jun;26(6):2850-62. doi: 10.1093/cercor/bhw030. Epub 2016 Apr 5. Cereb Cortex. 2016. PMID: 27048427 Free PMC article. - Dissociable effects of bottom-up and top-down factors on the processing of unattended fearful faces.
Hsu SM, Pessoa L. Hsu SM, et al. Neuropsychologia. 2007 Oct 1;45(13):3075-86. doi: 10.1016/j.neuropsychologia.2007.05.019. Epub 2007 Jun 13. Neuropsychologia. 2007. PMID: 17631362 Free PMC article. - Temporal precedence of emotion over attention modulations in the lateral amygdala: Intracranial ERP evidence from a patient with temporal lobe epilepsy.
Pourtois G, Spinelli L, Seeck M, Vuilleumier P. Pourtois G, et al. Cogn Affect Behav Neurosci. 2010 Mar;10(1):83-93. doi: 10.3758/CABN.10.1.83. Cogn Affect Behav Neurosci. 2010. PMID: 20233957 - The human amygdala disconnecting from auditory cortex preferentially discriminates musical sound of uncertain emotion by altering hemispheric weighting.
Manno FAM 3rd, Lau C, Fernandez-Ruiz J, Manno SH, Cheng SH, Barrios FA. Manno FAM 3rd, et al. Sci Rep. 2019 Oct 15;9(1):14787. doi: 10.1038/s41598-019-50042-1. Sci Rep. 2019. PMID: 31615998 Free PMC article. - Functional magnetic resonance imaging of temporally distinct responses to emotional facial expressions.
Haas BW, Constable RT, Canli T. Haas BW, et al. Soc Neurosci. 2009;4(2):121-34. doi: 10.1080/17470910802176326. Epub 2008 Jun 12. Soc Neurosci. 2009. PMID: 18633831 Free PMC article.
References
- Adolphs R, Tranel D, Damasio A, Damasio H (1994): Impaired recognition of emotion in facial expressions following bilateral damage to the human amygdala. Nature 372: 669–672. - PubMed
- Bechara A, Tranel D, Damasio H, Adolphs R, Rockland C, Damasio AR (1995): Double dissociation of conditioning and declarative knowledge relative to the amygdala and hippocampus in humans. Science 269: 1115–1118. - PubMed
- Brammer M, Bullmore E, Simmons A, Williams S, Grasby P, Howard R, Woodruff P, Rabe‐Hesketh S (1997): Generic brain activation mapping in functional magnetic resonance imaging: a non parametric approach. Magn Reson Imaging 15: 763–770. - PubMed
- Breiter H, Etcoff N, Whalen P, Kennedy W, Rauch S, Strauss M, Hyman S, Rosen B (1996): Response and habituation of the human amygdala during visual processing of facial expressions. Neuron 17: 875–887. - PubMed
Publication types
MeSH terms
LinkOut - more resources
Full Text Sources


