Estrogen prevents the lipopolysaccharide-induced inflammatory response in microglia - PubMed (original) (raw)
Estrogen prevents the lipopolysaccharide-induced inflammatory response in microglia
E Vegeto et al. J Neurosci. 2001.
Abstract
After neuronal injury and in several neurodegenerative diseases, activated microglia secrete proinflammatory molecules that can contribute to the progressive neural damage. The recent demonstration of a protective role of estrogen in neurodegenerative disorders in humans and experimental animal models led us to investigate whether this hormone regulates the inflammatory response in the CNS. We here show that estrogen exerts an anti-inflammatory activity on primary cultures of rat microglia, as suggested by the blockage of the phenotypic conversion associated with activation and by the prevention of lipopolysaccharide-induced production of inflammatory mediators: inducible form of NO synthase (iNOS), prostaglandin-E(2) (PGE(2)), and metalloproteinase-9 (MMP-9). These effects are dose-dependent, maximal at 1 nm 17beta-estradiol, and can be blocked by the estrogen receptor (ER) antagonist ICI 182,780. The demonstration of ERalpha and ERbeta expression in microglia and macrophages and the observation of estrogen blockade of MMP-9 mRNA accumulation and MMP-9 promoter induction further support the hypothesis of a genomic activity of estrogen via intracellular receptors. This is the first report showing an anti-inflammatory activity of estrogen in microglia. Our study proposes a novel explanation for the protective effects of estrogen in neurodegenerative and inflammatory diseases and provides new molecular and cellular targets for the screening of ER ligands acting in the CNS.
Figures
Fig. 1.
LPS-induced morphological activation is prevented by estrogen in primary cultures of rat microglia. _A,_ED-1 immunocytochemistry analysis in microglial cells treated for 16 hr in the absence (a) or presence of 0.5 μg/ml LPS (b) or LPS + 1 n
m
17β-estradiol (c) added 4 hr before the endotoxin.B, C, Quantitative assessment of the morphological changes induced by LPS alone (−) and 17β-estradiol (E 2), 17α-estradiol (17α-E2), ICI 182,780 (ICI), or ICI together with 17β-estradiol (ICI + E2) (B) or 17β-estradiol at different time intervals: 4, 2, 1, and 0.5 hr before or simultaneously (_t_0) with LPS (C). Values represent the percentage of activated per total cells and are the mean ± SD of three separate experiments performed in triplicate samples. *p < 0.05, as compared with the LPS-treated values, **p< 0.05, as compared with the LPS and LPS + E2-treated values, were calculated by ANOVA test, followed by a Bonferroni analysis. Photographs were made by using a 990 Coolpix digital photocamera (Nikon, Milan, Italy), then visualized and printed using standard computer programs. Scale bars, 30 μm.
Fig. 2.
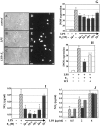
LPS-induced iNOS synthesis and NO2− accumulation is attenuated by estrogen in microglia. A–F, iNOS immunocytochemistry analysis in microglial cells treated for 16 hr in the absence (control; A, D) or presence of 0.5 μg/ml LPS (LPS; B, E) or LPS + 1 n
m
17β-estradiol (LPS + E 2; C, F). G, H, Quantitative assessment of iNOS expression. iNOS immunoreactivity was calculated by counting cells first with a phase-contrast light (corresponding to the total cell number) and then under fluorescence emission (iNOS-positive cells). I, J, Supernatants from primary cultures of rat microglia were analyzed for NO2−content, as described in Materials and Methods. Microglial cells were assayed in the absence (empty boxes) or presence of 1 n
m
17β-estradiol (E2; light gray boxes) or by adding LPS alone (dashed boxes) or in the presence of E2 added 4 hr before LPS (black boxes) or together with the bacterial endotoxin (dark gray boxes), in the presence of 100 n
m
ICI 182,780 (ICI) and E2. Increasing molar concentrations of E2 were assayed with 0.5 μg/ml LPS (G, I), whereas increasing concentrations of LPS were assayed with 1 n
m
estrogen (J). NO2−values from untreated cells or from cells treated with 1 n
m
E2 alone were below the detectable limit (0.09 μg/ml). Values represent the mean ± SD of triplicate determinations and are representative of at least three separate experiments. °p < 0.01, as compared with the control; *p < 0.05, as compared with the LPS-treated values, and **p < 0.05, as compared with both LPS and LPS + E2 values, were calculated by ANOVA test, followed by a Bonferroni analysis. Cells were photographed on Eastman Kodak (Rochester, NY) 200 ASA films using direct (A–C) or phase-contrast light (D–F); identical areas of cell culture photographed in A–C were analyzed under fluorescent emission (D–F) and photographed on 400 ASA films. Scale bars, 200 μm.
Fig. 3.
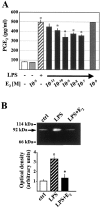
Estrogen attenuates LPS-induced production of PGE2 and gelatinase-B in microglia. Supernatants from primary cultures of rat microglia were collected and analyzed for PGE2 content (A) or gelatinolytic activity (B). Cells were treated in the absence (empty boxes) or presence of molar concentrations of 17β-estradiol (E2;light gray boxes), 0.5 μg/ml LPS (dashed boxes), or in the presence of LPS and estrogen added 4 hr (LPS + E 2; black boxes) or simultaneously with the endotoxin (dark gray boxes), as indicated in the graphs. B, A representative zimography, where the numbers to the_left_ indicate the location of the molecular weight markers and of the gelatinolytic activity (MMP-9), and the densitometric evaluation of the bands obtained from three independent experiments in duplicates are reported; values are represented by arbitrary units. °p < 0.01, as compared with the control, and *p < 0.05, as compared with the LPS-treated values, were calculated by ANOVA test, followed by a Bonferroni analysis.
Fig. 4.
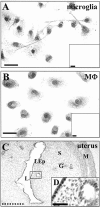
Expression of ER-α and ER-β in microglia and macrophages. Direct-light photomicrographs of ER-α immunoreactivity in microglia (A) and macrophages (MΦ;B). The small insets correspond to a parallel immunostaining in which the primary antibody was omitted.C, ERα distribution in the luminal epithelium (LEp), gland cells (G), stroma (S), and smooth muscle structures (M) of rat uterus. L,Lumen. D , Magnification of the_boxed area in C, showing the nuclear localization of the staining. Black bars are 40 μm,dashed bar is 1 mm, and bar in_D is 10 μm. Photographs were made by using a 990 Coolpix digital photocamera, then visualized and printed using standard computer programs.
Fig. 5.
Expression of ER-β mRNA in microglia and macrophages. Microglia and macrophage (MΦ) ER-α (A, B), ER-β (C, D), and GAPDH (E, F) mRNAs were assayed by RT-PCR, followed by Southern blot analysis (A–D). The annealing site of the PCR primers are reported as black boxes with the representation of the respective rat and human (hum) cDNAs; the length of the amplification products are reported on the_left_ of each panel. Rat uterus (Ut), liver (Liv), MCF-7 cells, or negative controls (blank, in which microglia or macrophage RNAs were assayed without adding the RT enzyme) were also analyzed. Hybridized membranes were exposed to autoradiographic films for 1 hr (A, B) or 3 hr (C, D) at room temperature. E, F, Photographs of the GAPDH amplification products on ethidium bromide-stained gels.
Fig. 6.
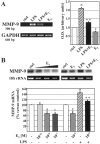
MMP-9 mRNA content is regulated by estrogen in microglia and macrophages. A, Microglia MMP-9 and GAPDH mRNAs were assayed by RT-PCR. Photographs of the amplification products separated on ethidium bromide-stained agarose gels are reported together with the length of the amplification products reported on the_left_. A quantitative assessment of the intensity of the bands is reported in the graph on the right and represents the mean ± SD of three separate experiments. B, A representative Northern blot analysis showing the 2.8 kb human MMP-9 mRNA and the 18S ribosomal RNA (rRNA) loaded on the gel. The densitometric evaluation of the bands obtained from three independent experiments is represented in the bottom part of_B_; values are represented as percentage in respect to control values and are calculated as the mean ± SD. Cells were treated in the absence (empty boxes) or presence of increasing molar concentrations of 17β-estradiol (E 2) (light gray to_dark gray boxes_), 0.5 μg/ml LPS (dashed boxes), or in the presence of both LPS and estrogen (LPS + E2; black boxes), as indicated in the graphs. °p < 0.01, as compared with the control, *p < 0.05, as compared with the control values, and **p < 0.05, as compared with LPS values, were calculated by ANOVA test, followed by a Bonferroni analysis.
Fig. 7.
MMP-9 promoter activity is modulated by ER-α. ER-negative SK-N-BE cells were transiently transfected with the 2200 bp (A) or 670 bp (B) fragments of the hMMP-9 promoter, in the absence or presence of hER-α expression vector. Cells were treated with 10 n
m
PMA and/or 10 n
m
17β-estradiol (E 2), as specified _above_each figure. In B, 0.01, 0.1, 1, and 10 n
m
17β-estradiol were assayed. The reported promoter activity is calculated by normalizing the CAT level with protein content and represents the mean ± SD of triplicate determinations, representative of at least three separate experiments. °p < 0.01, as compared with the control, i.e., untreated cells without transfected ER-α, *p < 0.05, as compared with the LPS value of the same experimental group, and ··p < 0.05, as compared with ER-α-transfected cells without treatment, were calculated by ANOVA test, followed by a Bonferroni analysis.
Similar articles
- Estrogen modulates microglial inflammatory mediator production via interactions with estrogen receptor beta.
Baker AE, Brautigam VM, Watters JJ. Baker AE, et al. Endocrinology. 2004 Nov;145(11):5021-32. doi: 10.1210/en.2004-0619. Epub 2004 Jul 15. Endocrinology. 2004. PMID: 15256495 - Estrogen or estrogen receptor agonist inhibits lipopolysaccharide induced microglial activation and death.
Smith JA, Das A, Butler JT, Ray SK, Banik NL. Smith JA, et al. Neurochem Res. 2011 Sep;36(9):1587-93. doi: 10.1007/s11064-010-0336-7. Epub 2010 Dec 3. Neurochem Res. 2011. PMID: 21127968 Free PMC article. - Estrogen modulates in vitro T cell responses in a concentration- and receptor-dependent manner: effects on intracellular molecular targets and antioxidant enzymes.
Priyanka HP, Krishnan HC, Singh RV, Hima L, Thyagarajan S. Priyanka HP, et al. Mol Immunol. 2013 Dec;56(4):328-39. doi: 10.1016/j.molimm.2013.05.226. Epub 2013 Aug 1. Mol Immunol. 2013. PMID: 23911387 - Diabetes undermines estrogen control of inducible nitric oxide synthase function in rat aortic smooth muscle cells through overexpression of estrogen receptor-beta.
Maggi A, Cignarella A, Brusadelli A, Bolego C, Pinna C, Puglisi L. Maggi A, et al. Circulation. 2003 Jul 15;108(2):211-7. doi: 10.1161/01.CIR.0000079311.39939.94. Epub 2003 Jun 23. Circulation. 2003. PMID: 12821541 - Antiinflammatory effects of estrogen on microglial activation.
Bruce-Keller AJ, Keeling JL, Keller JN, Huang FF, Camondola S, Mattson MP. Bruce-Keller AJ, et al. Endocrinology. 2000 Oct;141(10):3646-56. doi: 10.1210/endo.141.10.7693. Endocrinology. 2000. PMID: 11014219
Cited by
- Salivary Transmembrane Mucins of the MUC1 Family (CA 15-3, CA 27.29, MCA) in Breast Cancer: The Effect of Human Epidermal Growth Factor Receptor 2 (HER2).
Dyachenko EI, Bel'skaya LV. Dyachenko EI, et al. Cancers (Basel). 2024 Oct 12;16(20):3461. doi: 10.3390/cancers16203461. Cancers (Basel). 2024. PMID: 39456554 Free PMC article. - Acute postnatal inflammation alters adult microglial responses to LPS that are sex-, region- and timing of postnatal inflammation-dependent.
Nikodemova M, Oberto JR, Kaye EL, Berschel MR, Michaelson AL, Watters JJ, Mitchell GS. Nikodemova M, et al. J Neuroinflammation. 2024 Oct 10;21(1):256. doi: 10.1186/s12974-024-03245-x. J Neuroinflammation. 2024. PMID: 39390483 Free PMC article. - Inhibition of neuroinflammation and neuronal damage by the selective non-steroidal ERβ agonist AC-186.
Katola FO, Adana MY, Olajide OA. Katola FO, et al. Inflamm Res. 2024 Dec;73(12):2109-2121. doi: 10.1007/s00011-024-01952-y. Epub 2024 Oct 3. Inflamm Res. 2024. PMID: 39361032 Free PMC article. - Ovariectomy and Estradiol Supplementation Prevents Cyclophosphamide- and Doxorubicin-Induced Spatial Memory Impairment in Tumor-Bearing MMTV-PyVT Mice.
Botelho R, Philpot RM. Botelho R, et al. eNeuro. 2024 Sep 20;11(9):ENEURO.0206-24.2024. doi: 10.1523/ENEURO.0206-24.2024. Print 2024 Sep. eNeuro. 2024. PMID: 39187375 Free PMC article. - Acute Postnatal Inflammation Alters Adult Microglial Responses to LPS that Are Sex-, Region- and Timing of Postnatal Inflammation-Dependent.
Nikodemova M, Oberto JR, Berschel MR, Michaelson AL, Watters JJ, Mitchell GS. Nikodemova M, et al. Res Sq [Preprint]. 2024 Jun 27:rs.3.rs-4565866. doi: 10.21203/rs.3.rs-4565866/v1. Res Sq. 2024. PMID: 38978595 Free PMC article. Updated. Preprint.
References
- Adamson DC, Wildemann B, Sasaki M, Glass JD, McArthur JC, Christov VI, Dawson TM, Dawson VL. Immunologic NO synthase: elevation in severe AIDS dementia and induction by HIV-a gp41. Science. 1996;274:1917–1921. - PubMed
- Bettini E, Maggi A. Estrogen induction of cytochrome c oxidase subunit III in rat hippocampus. J Neurochem. 1992;58:1923–1929. - PubMed
- Beyer C, Karolczak M. Estrogenic stimulation of neurite growth in midbrain dopaminergic neurons depends o cAMP/protein kinase-A signaling. J Neurosci Res. 2000;59:107–116. - PubMed
- Bo L, Dawson TM, Wesselingh S, Mork S, Choi S, Kong PA, Hanley D, Trapp BD. Induction of nitric synthase in demyelinating regions of multiple sclerosis brains. Ann Neurol. 1994;36:778–786. - PubMed
Publication types
MeSH terms
Substances
LinkOut - more resources
Full Text Sources
Other Literature Sources
Miscellaneous


