Differential regulation of transmitter release by presynaptic and glial Ca2+ internal stores at the neuromuscular synapse - PubMed (original) (raw)
Differential regulation of transmitter release by presynaptic and glial Ca2+ internal stores at the neuromuscular synapse
A Castonguay et al. J Neurosci. 2001.
Abstract
The differential regulation of synaptic transmission by internal Ca(2+) stores of presynaptic terminals and perisynaptic Schwann cells (PSCs) was studied at the frog neuromuscular junction. Thapsigargin (tg), an inhibitor of Ca(2+)-ATPase pumps of internal stores, caused a transient Ca(2+) elevation in PSCs, whereas it had no effect on Ca(2+) stores of presynaptic terminals at rest. Tg prolonged presynaptic Ca(2+) responses evoked by single action potentials with no detectable increase in the resting Ca(2+) level in nerve terminals. However, Ca(2+) accumulation was observed during high frequency stimulation. Tg induced a rapid rise in endplate potential (EPP) amplitude, accompanied by a delayed and transient increase. The effects appeared presynaptic, as suggested by the lack of effects of tg on the amplitude and time course of miniature EPPs (MEPPs). However, MEPP frequency was increased when preparations were stimulated tonically (0.2 Hz). The delayed and transient increase in EPP amplitude was occluded by injections of the Ca(2+) chelator BAPTA into PSCs before tg application, whereas a rise in intracellular Ca(2+) in PSCs induced by inositol 1,4,5-triphosphate (IP(3)) injections potentiated transmitter release. Furthermore, increased Ca(2+) buffering capacity after BAPTA injection in PSCs resulted in a more pronounced synaptic depression induced by high frequency stimulation of the motor nerve (10 Hz/80 sec). It is concluded that presynaptic Ca(2+) stores act as a Ca(2+) clearance mechanism to limit the duration of transmitter release, whereas Ca(2+) release from glial stores initiates Ca(2+)-dependent potentiation of synaptic transmission.
Figures
Fig. 1.
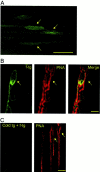
Distribution of tg labeling at the frog NMJ.A, False color confocal images of an amphibian NMJ labeled with f-tg (2 μ
m
). Arrows point at PSC somata. B, False color confocal images of an NMJ double-labeled with f-tg (green) and PNA-T (red). The two images were acquired simultaneously by using the dual channel configuration of an MRC 600 confocal microscope and were superimposed (Merge) to determine the distribution of the f-tg in relation to the NMJ, as indicated by PNA-T staining. Note the presence of a PSC soma and also note that the f-tg labeling is located within the boundaries delineated by the PNA-T staining. C, False color confocal images of an NMJ preincubated with unlabeled tg (2 μ
m
) for 10 min and then double-labeled with f-tg (2 μ
m
) and PNA-T. The two images were acquired simultaneously by using the dual channel configuration of an MRC 600 confocal microscope. Note the lack of labeling when the preparations were exposed to unlabeled tg before the incubation with f-tg. Scale bars: A, C, 20 μm; B, 10 μm.
Fig. 2.
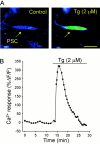
Thapsigargin causes a transient Ca2+ elevation in PSCs. A, False color confocal images of a PSC (arrow) loaded with fluo-3 AM at rest (Control, before bath application of tg) and at the peak of the Ca2+ response elicited by the bath application of tg (2 μ
m
). _Blue_indicates a low level of Ca2+ and red_a high level. B, Time course of the relative changes of Ca2+ fluorescence in the PSC illustrated in_A before and during tg application. Similar results were obtained in nine cells from seven preparations. Scale bar, 10 μm.
Fig. 3.
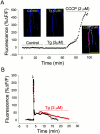
Effects of thapsigargin on the Ca2+ level of presynaptic terminals.A, Relative changes of the basal fluorescence in a nerve terminal loaded with Ca2+–green-1 dextran at rest, during the application of tg (2 μ
m
), and in the presence of the mitochondria inhibitor CCCP (2 μ
m
).Insets show false color images of the nerve terminal at rest (Control), during the application of tg, and in the presence of CCCP. Blue indicates low levels of Ca2+ and red indicates high levels. Note that tg did not cause any Ca2+ elevation in the nerve terminal. However, CCCP (2 μ
m
) induced a Ca2+ rise, indicating that the detection method was appropriate. Scale bar, 25 μm. B, Relative changes of the fluorescence in a nerve terminal loaded with Ca2+–green-1 dextran before, during, and after a train of stimuli (100 Hz, 30 sec; arrow) in control (black circles) and in the presence of tg (2 μ
m
; red circles) applied during the recovery phase of the response. Note that the presence of tg prolonged the recovery phase of the Ca2+ response.
Fig. 4.
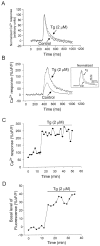
Thapsigargin prolongs Ca2+clearance in nerve terminals. A, Relative changes in fluorescence emitted by a nerve terminal backfilled with Ca2+–green-1 and obtained by using the line scan mode of the Bio-Rad 600 confocal microscope. Each record is an average of 20 individual traces normalized to peak amplitude for Ca2+ responses evoked by a single action potential before (Control) and after 15 min of perfusion with tg (2 μ
m
). Note that tg prolonged the duration of the recovery of the Ca2+response. B, Relative changes in fluorescence emitted by a nerve terminal backfilled with Ca2+–green-1 and obtained by using the line scan mode of the Bio-Rad 600 confocal. Shown are Ca2+ responses evoked by a brief train of stimuli (100 Hz, 100 msec) in control and 20 min after the beginning of tg (2 μ
m
) perfusion. The control record is an average of eight individual traces. Note that both the duration and the amplitude of the Ca2+ responses were increased in the presence of tg. Inset, Average of 10 traces normalized to peak amplitude in control and after tg application. AU, Arbitrary units of fluorescence. C, From the same experiment as in B, the amplitude of Ca2+ responses collected after a 100 Hz/100 msec stimulation and plotted as a function of time before and during tg application. Note that the effect occurs rapidly and persists throughout the application of tg. D, Relative changes of the basal fluorescence in a nerve terminal loaded with Ca2+–green-1 dextran and stimulated at 2 min intervals with trains of 100 Hz at 100 msec before and during the application of tg (2 μ
m
). Note the elevation of the basal Ca2+ level in the nerve terminal a few minutes after tg application.
Fig. 5.
Thapsigargin potentiates transmitter release. A, Changes in amplitude of the first evoked EPP before, during, and after the bath application of tg (2 μ
m
). EPPs were evoked by paired pulse stimulation (10 msec interval) at 0.2 Hz. Shown in the inset are EPPs in control and at the peak of the tg effect (Tg). Note that the potentiation of EPP amplitude by tg is transient and that a partial recovery is observed even when tg is still present in the perfusate. After the transient phase the EPP amplitude stabilized above the control level. B, Histograms of mean ± SEM of MEPP frequency and amplitude obtained on nonstimulated preparations (n = 5) in control and at times corresponding to the peak of the tg effect and the stable recovery phase. Note that tg had no effect on MEPP amplitude and frequency.C, Histograms of mean ± SEM of MEPP rise time and decay time obtained on nonstimulated preparations (n = 5) in control and at times corresponding to the peak of the tg effect and the stable recovery phase. Note that tg had no effect on either the rise or decay time of the MEPPs. D, EPPs evoked by paired pulse stimuli in control and at the peak of tg (2 μ
m
) effects. The amplitude of the first EPP recorded in the presence of tg was adjusted to fit the amplitude of the first EPP in control. Note that the amplitudes of the second EPPs of the pairs recorded in control and in the presence of tg are superimposed perfectly, suggesting that the level of facilitation was the same in both conditions.
Fig. 6.
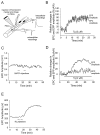
Potentiation of synaptic transmission by PSCs.A, Experimental model of the three-electrode recording method. Intracellular recordings of synaptic activity generated by the whole NMJ were performed simultaneously with extracellular recordings, using a focal electrode, which monitored the portion of the presynaptic terminal covered by a PSC injected via the third electrode.B, EPC and EPP amplitude expressed as a percentage of change relative to control before and during the bath application of tg (2 μ
m
) after the injection of the PSC covering the portion of the nerve terminal recorded by the focal electrode with the vehicle solution (500 m
m
K+-acetate and 10 μ
m
Ca2+–green-1). Changes in EPC amplitude represent the activity of the nerve terminal covered by the injected PSC, whereas changes in EPP amplitude represent changes occurring at the whole NMJ. Note that tg induced a similar increase in EPP amplitude (whole NMJ activity) and in EPC amplitude (portion of the terminal covered by the injected PSC). C, EPC amplitude recorded by a focal electrode located near the portion of a nerve terminal covered by a PSC before, during, and after the injection of BAPTA (10 m
m
in the electrode) in the PSC. EPCs were evoked by nerve stimulation at 0.2 Hz. Note that BAPTA injection had no effect on synaptic transmission. D, EPC and EPP amplitude expressed as a percentage of changes relative to control before and during bath application of tg (2 μ
m
) after the injection of BAPTA (10 m
m
in the electrode) in the PSC covering the portion of the nerve terminal recorded by the focal electrode. Note that tg induced a rapid rise, followed by a second, slower increase in EPP amplitude (whole NMJ activity) but induced only a small and rapid rise in EPC amplitude (portion of the terminal covered by the injected PSC). E, EPC amplitude before and after the injection of IP3 (10 m
m
in the electrode) in the PSC covering the portion of the nerve terminal recorded by the focal electrode. EPCs were evoked by motor nerve stimulation at 0.2 Hz. Note that the injection of IP3 in PSCs potentiated transmitter release.
Fig. 7.
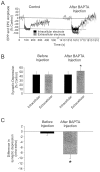
Synaptic depression is modulated by PSCs.A, Changes in EPC (gray trace) amplitude and EPP (black trace) amplitude expressed as a percentage of control before, during, and after the induction of high frequency depression (10 Hz/80 sec) at the frog NMJ. Note that the focal and intracellular recordings show the same amplitude of depression. After the injection of BAPTA into a PSC (break in_x_-axis) the focal electrode (gray trace), which records synaptic transmission under the injected PSC, shows a bigger depression than the intracellular one, thus suggesting that the presence of BAPTA in PSC blocked the potentiating effect on synaptic transmission. B, Mean ± SEM of synaptic depression relative to control level for intracellular and extracellular recordings before and after BAPTA injection into PSCs. Note that, after BAPTA injection, depression detected by the focal electrode was significantly greater. C, Mean ± SEM of the difference between intracellular and extracellular depression in control and after BAPTA injection into PSCs. Note that, after BAPTA injection, the difference between the amplitude of depression recorded by the intracellular and focal electrodes was significantly greater.
Fig. 8.
Differential regulation of transmitter release by presynaptic and glial internal stores. A, Diagram of a cross section of a presynaptic nerve terminal covered by a perisynaptic Schwann cell (PSC). In the presynaptic terminal, a blockade of the ATPase pump with tg led to a reduction in the clearance of Ca2+, whereas it resulted in a release of Ca2+ from the internal stores of PSCs. The release of Ca2+ from PSC internal stores is regulated by IP3 receptors. B, Schematic representation depicting the relative contribution of the presynaptic and the glial components of tg effects on transmitter release. C, Proposed functional model of the ATPase pump of internal stores of presynaptic terminals, based on the results presented in this study. According to the dynamics of Ca2+ entry and handling around an active zone in the nerve terminal and the local changes in presynaptic resting Ca2+ level produced by tg, we propose that the ATPase pump is located in the membrane of synaptic vesicles located around release sites. They are located in a zone (gray zone, ∼50 nm) in which the regulation of Ca2+ dynamics likely will affect transmitter release. Hence, this suggests that synaptic vesicles might act as an autoregulatory mechanism in transmitter release. D, Proposed model of the Ca2+-dependent glial regulation of transmitter release. Because the duration of the PSC-dependent regulation of transmitter release by tg outlasts by several tens of minutes the duration of the resultant rise in intracellular Ca2+, we propose that the PSC regulation is mediated by the Ca2+-dependent production of neuromodulatory glial factors. Hence, as a consequence of synaptic activity, glial receptors would be activated, triggering IP3 production by phospholipase C, which would result in the release of Ca2+ from internal stores. This Ca2+ then would be pumped back partially into the stores by the ATPase but also would activate Ca2+-dependent second messenger cascades, leading to the production of membrane-permeant neuromodulatory substances that would reach the presynaptic nerve terminal to regulate the release machinery.
Similar articles
- Xestospongin C is a potent inhibitor of SERCA at a vertebrate synapse.
Castonguay A, Robitaille R. Castonguay A, et al. Cell Calcium. 2002 Jul;32(1):39-47. doi: 10.1016/s0143-4160(02)00093-3. Cell Calcium. 2002. PMID: 12127061 - Differential frequency-dependent regulation of transmitter release by endogenous nitric oxide at the amphibian neuromuscular synapse.
Thomas S, Robitaille R. Thomas S, et al. J Neurosci. 2001 Feb 15;21(4):1087-95. doi: 10.1523/JNEUROSCI.21-04-01087.2001. J Neurosci. 2001. PMID: 11160378 Free PMC article. - Intraterminal Ca(2+) and spontaneous transmitter release at the frog neuromuscular junction.
Angleson JK, Betz WJ. Angleson JK, et al. J Neurophysiol. 2001 Jan;85(1):287-94. doi: 10.1152/jn.2001.85.1.287. J Neurophysiol. 2001. PMID: 11152728 - Influence of heavy metals on synaptic transmission: a review.
Cooper GP, Manalis RS. Cooper GP, et al. Neurotoxicology. 1983 Winter;4(4):69-83. Neurotoxicology. 1983. PMID: 6322059 Review. - Neuron-glia interactions at the neuromuscular synapse.
Todd KJ, Robitaille R. Todd KJ, et al. Novartis Found Symp. 2006;276:222-9; discussion 229-37, 275-81. Novartis Found Symp. 2006. PMID: 16805433 Review.
Cited by
- Schwann cell-derived factors modulate synaptic activities at developing neuromuscular synapses.
Cao G, Ko CP. Cao G, et al. J Neurosci. 2007 Jun 20;27(25):6712-22. doi: 10.1523/JNEUROSCI.1329-07.2007. J Neurosci. 2007. PMID: 17581958 Free PMC article. - Ca2+ syntillas, miniature Ca2+ release events in terminals of hypothalamic neurons, are increased in frequency by depolarization in the absence of Ca2+ influx.
De Crescenzo V, ZhuGe R, Velázquez-Marrero C, Lifshitz LM, Custer E, Carmichael J, Lai FA, Tuft RA, Fogarty KE, Lemos JR, Walsh JV Jr. De Crescenzo V, et al. J Neurosci. 2004 Feb 4;24(5):1226-35. doi: 10.1523/JNEUROSCI.4286-03.2004. J Neurosci. 2004. PMID: 14762141 Free PMC article. - Emerging roles of mitochondria in synaptic transmission and neurodegeneration.
Lee A, Hirabayashi Y, Kwon SK, Lewis TL Jr, Polleux F. Lee A, et al. Curr Opin Physiol. 2018 Jun;3:82-93. doi: 10.1016/j.cophys.2018.03.009. Epub 2018 Mar 28. Curr Opin Physiol. 2018. PMID: 30320242 Free PMC article. - Ultrafast and Slow Cholinergic Transmission. Different Involvement of Acetylcholinesterase Molecular Forms.
Dunant Y, Gisiger V. Dunant Y, et al. Molecules. 2017 Aug 4;22(8):1300. doi: 10.3390/molecules22081300. Molecules. 2017. PMID: 28777299 Free PMC article. Review. - IP3 receptors and associated Ca2+ signals localize to satellite cells and to components of the neuromuscular junction in skeletal muscle.
Powell JA, Molgó J, Adams DS, Colasante C, Williams A, Bohlen M, Jaimovich E. Powell JA, et al. J Neurosci. 2003 Sep 10;23(23):8185-92. doi: 10.1523/JNEUROSCI.23-23-08185.2003. J Neurosci. 2003. PMID: 12967979 Free PMC article.
References
- Araque A, Parpura V, Sanzgiri RP, Haydon PG. Tripartite synapses: glia, the unacknowledged partner. Trends Neurosci. 1999;22:208–215. - PubMed
- Augustine GJ, Charlton MP, Smith SJ. Calcium action in synaptic transmitter release. Annu Rev Neurosci. 1987;10:633–693. - PubMed
- Augustine GJ, Adler EM, Charlton MP. The calcium signal for transmitter secretion from presynaptic nerve terminals. Ann NY Acad Sci. 1991;633:365–381. - PubMed
Publication types
MeSH terms
Substances
LinkOut - more resources
Full Text Sources
Miscellaneous
