Circularly permuted green fluorescent proteins engineered to sense Ca2+ - PubMed (original) (raw)
Circularly permuted green fluorescent proteins engineered to sense Ca2+
T Nagai et al. Proc Natl Acad Sci U S A. 2001.
Abstract
To visualize Ca(2+)-dependent protein-protein interactions in living cells by fluorescence readouts, we used a circularly permuted green fluorescent protein (cpGFP), in which the amino and carboxyl portions had been interchanged and reconnected by a short spacer between the original termini. The cpGFP was fused to calmodulin and its target peptide, M13. The chimeric protein, which we have named "pericam," was fluorescent and its spectral properties changed reversibly with the amount of Ca(2+), probably because of the interaction between calmodulin and M13 leading to an alteration of the environment surrounding the chromophore. Three types of pericam were obtained by mutating several amino acids adjacent to the chromophore. Of these, "flash-pericam" became brighter with Ca(2+), whereas "inverse-pericam" dimmed. On the other hand, "ratiometric-pericam" had an excitation wavelength changing in a Ca(2+)-dependent manner. All of the pericams expressed in HeLa cells were able to monitor free Ca(2+) dynamics, such as Ca(2+) oscillations in the cytosol and the nucleus. Ca(2+) imaging using high-speed confocal line-scanning microscopy and a flash-pericam allowed to detect the free propagation of Ca(2+) ions across the nuclear envelope. Then, free Ca(2+) concentrations in the nucleus and mitochondria were simultaneously measured by using ratiometric-pericams having appropriate localization signals, revealing that extra-mitochondrial Ca(2+) transients caused rapid changes in the concentration of mitochondrial Ca(2+). Finally, a "split-pericam" was made by deleting the linker in the flash-pericam. The Ca(2+)-dependent interaction between calmodulin and M13 in HeLa cells was monitored by the association of the two halves of GFP, neither of which was fluorescent by itself.
Figures
Figure 1
Schematic structures and sequences of pericams for expression in bacteria and mammalian cells. Sequences of linkers and amino acid substitutions are shown below and above the bars, respectively. His-6, the polyhistidine tag; kz, Kozak consensus sequence; nls, nuclear localization signal; coxIV, cytochrome c oxidase subunit IV targeting signal (12).
Figure 2
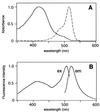
(A) Absorbance spectra of EYFP(V68L/Q69K) (broken line) and cpEYFP(V68L/Q69K) (solid line). (B) Fluorescence excitation (ex) and emission (em) spectra of cpEYFP(V68L/Q69K), recorded at 530-nm emission and 485-nm excitation, respectively. All spectra were normalized to a maximum value of 1.0.
Figure 3
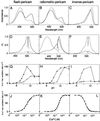
In vitro properties of flash-pericam (A,D, G, and J), ratiometric-pericam (B, E,H, and K), and inverse-pericam (C, F, I, and_L_). Absorbance (A_–_C) and fluorescence excitation and emission (D_–_F) spectra of pericams. pH-dependency of normalized amplitudes in 514-nm emission peak (G), 516-nm emission peak (I), and excitation ratio of 495/410 (H). (A_–_I) The spectra and data points were obtained in the presence (solid line) and absence (broken line) of Ca2+ ion. (J_–_L) Ca2+ titration curves of pericams. FI, fluorescence intensity.
Figure 4
(A) A confocal image of a HeLa cell expressing flash-pericam. (B) A line-scanned image along a longitudinal line in A of the histamine-evoked Ca2+ propagation. (C) The time course of Ca2+ signals in the cytosol and nucleus; their areas are indicated on the right side of B. (Scale bar = 10 μm.)
Figure 5
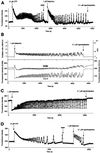
Typical [Ca2+]i transients and oscillations induced by receptor-stimulations in HeLa cells expressing flash-pericam (A), ratiometric-pericam (B), inverse-pericam (C), and split-pericam (D). The sampling interval was 3 ≈ 5 s. (B, Upper) Excitation ratios, 480 to 410 nm. The right-hand ordinate calibrates [Ca2+]i in pCa with_R_max and _R_min indicated by an arrow and arrowhead, respectively. (Lower) 480 nm (black line, left-hand scale) and 410 nm (gray line, right-hand scale) excitations.
Figure 6
(A) A series of pseudocolored images of four HeLa cells that expressed ratiometric-pericam-nu and -mt. From the Left Upper to the Right Lower, 0, 5, 10, and 65 s after 1 μM histamine application. Small and a large circles in the leftmost cell are regions of interest for measurements of [Ca2+]n and [Ca2+]m, respectively. Their time courses are shown in B. (C) A series of pseudocolored images of two HeLa cells expressing ratiometric-pericam-mt. Arrows indicate subpopulations of mitochondria transiently exhibiting high [Ca2+]m. (Scale bar = 10 μm.)
Similar articles
- Confocal imaging of subcellular Ca2+ concentrations using a dual-excitation ratiometric indicator based on green fluorescent protein.
Shimozono S, Fukano T, Nagai T, Kirino Y, Mizuno H, Miyawaki A. Shimozono S, et al. Sci STKE. 2002 Mar 26;2002(125):pl4. doi: 10.1126/stke.2002.125.pl4. Sci STKE. 2002. PMID: 11917155 - Fluorescent indicators for Ca2+ based on green fluorescent proteins and calmodulin.
Miyawaki A, Llopis J, Heim R, McCaffery JM, Adams JA, Ikura M, Tsien RY. Miyawaki A, et al. Nature. 1997 Aug 28;388(6645):882-7. doi: 10.1038/42264. Nature. 1997. PMID: 9278050 - Monitoring dynamic changes in mitochondrial calcium levels during apoptosis using a genetically encoded calcium sensor.
Akimzhanov AM, Boehning D. Akimzhanov AM, et al. J Vis Exp. 2011 Apr 1;(50):2579. doi: 10.3791/2579. J Vis Exp. 2011. PMID: 21490580 Free PMC article. - Engineering fluorescent proteins.
Miyawaki A, Nagai T, Mizuno H. Miyawaki A, et al. Adv Biochem Eng Biotechnol. 2005;95:1-15. doi: 10.1007/b102208. Adv Biochem Eng Biotechnol. 2005. PMID: 16080263 Review. - Green fluorescent protein--a bright idea for the study of bacterial protein localization.
Phillips GJ. Phillips GJ. FEMS Microbiol Lett. 2001 Oct 16;204(1):9-18. doi: 10.1111/j.1574-6968.2001.tb10854.x. FEMS Microbiol Lett. 2001. PMID: 11682170 Review.
Cited by
- Simultaneous readout of multiple FRET pairs using photochromism.
Roebroek T, Vandenberg W, Sipieter F, Hugelier S, Stove C, Zhang J, Dedecker P. Roebroek T, et al. Nat Commun. 2021 Mar 31;12(1):2005. doi: 10.1038/s41467-021-22043-0. Nat Commun. 2021. PMID: 33790271 Free PMC article. - Getting to grips with ammonium.
Wang Y, Javitch JA. Wang Y, et al. Elife. 2013 Jul 2;2:e01029. doi: 10.7554/eLife.01029. Elife. 2013. PMID: 23840933 Free PMC article. - Structural insight into enhanced calcium indicator GCaMP3 and GCaMPJ to promote further improvement.
Chen Y, Song X, Ye S, Miao L, Zhu Y, Zhang RG, Ji G. Chen Y, et al. Protein Cell. 2013 Apr;4(4):299-309. doi: 10.1007/s13238-013-2103-4. Epub 2013 Apr 3. Protein Cell. 2013. PMID: 23549615 Free PMC article. - Bimolecular Fluorescence Complementation (BiFC) Analysis: Advances and Recent Applications for Genome-Wide Interaction Studies.
Miller KE, Kim Y, Huh WK, Park HO. Miller KE, et al. J Mol Biol. 2015 Jun 5;427(11):2039-2055. doi: 10.1016/j.jmb.2015.03.005. Epub 2015 Mar 12. J Mol Biol. 2015. PMID: 25772494 Free PMC article. Review. - Quantitative two-photon imaging of fluorescent biosensors.
Yellen G, Mongeon R. Yellen G, et al. Curr Opin Chem Biol. 2015 Aug;27:24-30. doi: 10.1016/j.cbpa.2015.05.024. Epub 2015 Jun 12. Curr Opin Chem Biol. 2015. PMID: 26079046 Free PMC article. Review.
References
- Tsien R Y, Miyawaki A. Science. 1998;280:1954–1955. - PubMed
- Tsien R Y. Annu Rev Biochem. 1998;67:509–544. - PubMed
- Ormö M, Cubitt A B, Kallio K, Gross L A, Tsien R Y, Remington S J. Science. 1996;273:1392–1395. - PubMed
- Wachter R M, Elsliger M A, Kallio K, Hanson G T, Remington S J. Structure (London) 1998;6:1267–1277. - PubMed
Publication types
MeSH terms
Substances
LinkOut - more resources
Full Text Sources
Other Literature Sources
Research Materials
Miscellaneous


