Complete genomic sequence of Pasteurella multocida, Pm70 - PubMed (original) (raw)
Complete genomic sequence of Pasteurella multocida, Pm70
B J May et al. Proc Natl Acad Sci U S A. 2001.
Abstract
We present here the complete genome sequence of a common avian clone of Pasteurella multocida, Pm70. The genome of Pm70 is a single circular chromosome 2,257,487 base pairs in length and contains 2,014 predicted coding regions, 6 ribosomal RNA operons, and 57 tRNAs. Genome-scale evolutionary analyses based on pairwise comparisons of 1,197 orthologous sequences between P. multocida, Haemophilus influenzae, and Escherichia coli suggest that P. multocida and H. influenzae diverged approximately 270 million years ago and the gamma subdivision of the proteobacteria radiated about 680 million years ago. Two previously undescribed open reading frames, accounting for approximately 1% of the genome, encode large proteins with homology to the virulence-associated filamentous hemagglutinin of Bordetella pertussis. Consistent with the critical role of iron in the survival of many microbial pathogens, in silico and whole-genome microarray analyses identified more than 50 Pm70 genes with a potential role in iron acquisition and metabolism. Overall, the complete genomic sequence and preliminary functional analyses provide a foundation for future research into the mechanisms of pathogenesis and host specificity of this important multispecies pathogen.
Figures
Figure 1
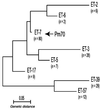
Genetic relationships among the eight common clones of_Pm_ recovered from avian sources. A total of 271 independent isolates of Pm recovered from 14 avian species were characterized for differences in electrophoretic mobility at 13 loci by MLEE. Of the 82 electrophoretic types that were identified, more than two-thirds of the isolates were represented by the eight clones shown in the dendrogram. Furthermore, a total of 31% of the isolates were represented by a single group, electrophoretic type 07 (arrow) that included the isolate Pm70.
Figure 2
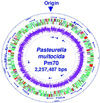
Circular representation of the genome of Pm, Pm70. The_Pm_ genome and its coding regions with homologies, the tRNA and rRNA operons, and the overall G-C content are presented. The outer circle represents the scale in base pairs with the origin noted. The outer arrows represent the 57 tRNAs and the inner arrows represent the 6 complete rRNA operons (16S–23S–5S). The 2,014 potential coding sequences are represented by colors depicting homology to both_Ec_ and Hi (green), Ec alone (purple), Hi alone (light blue), or to organisms other than Hi or Ec or unique to_Pm_ (red). The G-C % of each coding sequence is represented in the interior circle by different shades of pink in increments of 5%: the lightest pink represents a G-C % of 25–30% whereas the darkest pink represents 45–50%. The figure was generated by using
genescene
software (DNAstar, Madison, WI).
Figure 3
Genome-scale evolutionary comparisons between Pm,Hi, and Ec. Scatter plots were created from pairwise evolutionary distance (D) values, as described. The_x_ axis represents the pairwise D value for_Pm_ and Ec and the y axis represents the pairwise D value for either Hi and_Ec_ or Pm and Hi as indicated. (a) Scatterplot for the 774 conserved sequences and 243 divergent sequences. (b) Dendrogram showing the evolutionary distance in millions of years between_Pm_, Hi, and Ec. D values for each of the branch points are also presented.
Figure 4
A comprehensive view of the biochemical processes involved in_Pm_ pathogenicity. Orthologs previously identified as virulence factors in other organisms are represented. Principal functional categories are shown in bold. Potential coding sequences related to these functions are arranged within each correspondingly colored category.
Figure 5
Analysis of PfhB domains. Homology comparisons among PfhB1, PfhB2, from_Pm_, LspA1, LspA2, from H. ducreyi, FhaB from B. pertussis, and P76 from Haemophilus somnus are presented. Homologous domains are represented with the same colored boxes and the direct repeats in p76 and PfhA2 are patterned in blue. The N(P/Q)NG(I/M) extracellular processing motif is indicated and the integrin-binding protein motifs are shown as dark purple lines.
Figure 6
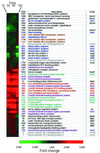
Hierarchical clustering of 53 Pm CDSs identified based on sequence comparisons to be involved in iron metabolism or to require iron as a co-factor. Fluorescent ratios representing relative expression profiles of Pm CDSs at 15, 30, 60, and 120 min time points are shown in (Left). The red and green colors represent fold increase and decrease, respectively, in gene expression in response to low iron conditions (addition of the iron chelator, 2,2′-dipyridyl). Their corresponding open reading frames numbers and CDS descriptions are also shown. CDSs depicted in the same color are in close proximity to each other on the genome and may be a part of potential operons.
Similar articles
- Pathogenomics of Pasteurella multocida.
Boyce JD, Seemann T, Adler B, Harper M. Boyce JD, et al. Curr Top Microbiol Immunol. 2012;361:23-38. doi: 10.1007/82_2012_203. Curr Top Microbiol Immunol. 2012. PMID: 22402726 Review. - Genome characterization of Pasteurella multocida subspecies septica and comparison with Pasteurella multocida subspecies multocida and gallicida.
Peng Z, Liang W, Liu W, Chen H, Wu B. Peng Z, et al. Arch Microbiol. 2017 May;199(4):635-640. doi: 10.1007/s00203-017-1341-x. Epub 2017 Feb 7. Arch Microbiol. 2017. PMID: 28175928 - Comparative genome analysis of an avirulent and two virulent strains of avian Pasteurella multocida reveals candidate genes involved in fitness and pathogenicity.
Johnson TJ, Abrahante JE, Hunter SS, Hauglund M, Tatum FM, Maheswaran SK, Briggs RE. Johnson TJ, et al. BMC Microbiol. 2013 May 14;13:106. doi: 10.1186/1471-2180-13-106. BMC Microbiol. 2013. PMID: 23672515 Free PMC article. - Genomic characterization of Pasteurella multocida HB01, a serotype A bovine isolate from China.
Peng Z, Liang W, Liu W, Wu B, Tang B, Tan C, Zhou R, Chen H. Peng Z, et al. Gene. 2016 Apr 25;581(1):85-93. doi: 10.1016/j.gene.2016.01.041. Epub 2016 Jan 28. Gene. 2016. PMID: 26827796 - Pasteurella multocida: Genotypes and Genomics.
Peng Z, Wang X, Zhou R, Chen H, Wilson BA, Wu B. Peng Z, et al. Microbiol Mol Biol Rev. 2019 Sep 4;83(4):e00014-19. doi: 10.1128/MMBR.00014-19. Print 2019 Nov 20. Microbiol Mol Biol Rev. 2019. PMID: 31484691 Free PMC article. Review.
Cited by
- Identification of the crp gene in avian Pasteurella multocida and evaluation of the effects of crp deletion on its phenotype, virulence and immunogenicity.
Zhao X, Liu Q, Xiao K, Hu Y, Liu X, Li Y, Kong Q. Zhao X, et al. BMC Microbiol. 2016 Jun 24;16(1):125. doi: 10.1186/s12866-016-0739-y. BMC Microbiol. 2016. PMID: 27343075 Free PMC article. - Chloramphenicol is a substrate for a novel nitroreductase pathway in Haemophilus influenzae.
Smith AL, Erwin AL, Kline T, Unrath WC, Nelson K, Weber A, Howald WN. Smith AL, et al. Antimicrob Agents Chemother. 2007 Aug;51(8):2820-9. doi: 10.1128/AAC.00087-07. Epub 2007 May 25. Antimicrob Agents Chemother. 2007. PMID: 17526758 Free PMC article. - Sialic Acid metabolism and systemic pasteurellosis.
Steenbergen SM, Lichtensteiger CA, Caughlan R, Garfinkle J, Fuller TE, Vimr ER. Steenbergen SM, et al. Infect Immun. 2005 Mar;73(3):1284-94. doi: 10.1128/IAI.73.3.1284-1294.2005. Infect Immun. 2005. PMID: 15731025 Free PMC article. - Isolation and sequencing of a temperate transducing phage for Pasteurella multocida.
Campoy S, Aranda J, Alvarez G, Barbé J, Llagostera M. Campoy S, et al. Appl Environ Microbiol. 2006 May;72(5):3154-60. doi: 10.1128/AEM.72.5.3154-3160.2006. Appl Environ Microbiol. 2006. PMID: 16672452 Free PMC article. - Identification of fur and fldA homologs and a Pasteurella multocida tbpA homolog in Histophilus ovis and effects of iron availability on their transcription.
Ekins A, Niven DF. Ekins A, et al. J Bacteriol. 2002 May;184(9):2539-42. doi: 10.1128/JB.184.9.2539-2542.2002. J Bacteriol. 2002. PMID: 11948169 Free PMC article.
References
- Pasteur L. Milestones in Microbiology: 1156 to 1940. 1998. , trans. and ed. Brock, T. D. (Am. Soc. Microbiol., Washington, DC), pp. 126–131.
- Rhoades K R, Rimler R B. In: Pasteurella and Pasteurellosis. Adlam C, Rutter J M, editors. San Diego, CA: Academic; 1989. pp. 95–114.
- Rhoades K R, Rimler R B. In: Diseases of Poultry. Calnek B W, Barnes H J, Beard C W, Reid W M, Yoder H W J, editors. Ames, IA: Iowa State Univ. Press; 1991. pp. 145–162.
- Fleischmann R D, Adams M D, White O, Clayton R A, Kirkness E F, Kerlavage A R, Bult C J, Tomb J-F, Dougherty B A, Merrick J M, et al. Science. 1995;269:496–512. - PubMed
Publication types
MeSH terms
Substances
LinkOut - more resources
Full Text Sources
Other Literature Sources
Molecular Biology Databases


