Restriction of secretory granule motion near the plasma membrane of chromaffin cells - PubMed (original) (raw)
Restriction of secretory granule motion near the plasma membrane of chromaffin cells
L M Johns et al. J Cell Biol. 2001.
Abstract
We used total internal reflection fluorescence microscopy to study quantitatively the motion and distribution of secretory granules near the plasma membrane (PM) of living bovine chromaffin cells. Within the approximately 300-nm region measurably illuminated by the evanescent field resulting from total internal reflection, granules are preferentially concentrated close to the PM. Granule motion normal to the substrate (the z direction) is much slower than would be expected from free Brownian motion, is strongly restricted over tens of nanometer distances, and tends to reverse directions within 0.5 s. The z-direction diffusion coefficients of granules decrease continuously by two orders of magnitude within less than a granule diameter of the PM as granules approach the PM. These analyses suggest that a system of tethers or a heterogeneous matrix severely limits granule motion in the immediate vicinity of the PM. Transient expression of the light chains of tetanus toxin and botulinum toxin A did not disrupt the restricted motion of granules near the PM, indicating that SNARE proteins SNAP-25 and VAMP are not necessary for the decreased mobility. However, the lack of functional SNAREs on the plasma or granule membranes in such cells reduces the time that some granules spend immediately adjacent to the PM.
Figures
Figure 3
ANP-GFP colocalizes with dopamine-β-hydroxylase (DBH). Immunocytochemistry was performed on chromaffin cells transfected with the ANP-GFP construct. Cells were fixed, and then permeabilized with absolute MeOH (−20°C). Cells were then processed for DBH (see Materials and Methods). (Left) GFP signal, (middle) anti–DBH signal, and (right) overlap of the GFP and anti–DBH signals. There was significant overlap of the GFP and DBH signals. Scale bar_:_ 2 μm.
Figure 1
TIRFM Optics. Cells are cultured on plastic culture dishes in which the bottom has been drilled out and a glass coverslip has been glued. The excitation light is provided by the 488-nm line of the laser focused by a long focal lengths just before the beam enters the microscope base. The beam then reflects up from the microscope's base optics, and TIRFM is created by a trapezoidal glass prism (flint glass, 1.648 refractive index, cut from a triangular prism commercially available from Rolyn Optics) mounted on the condenser mount. A thin layer of immersion oil separates the prism from the glass coverslip. The cells are visualized through a 0.75 NA 40× achromat water immersion objective (160-mm tube length) mounted on a Leitz Ortholux upright microscope. Local perfusion of individual cells can be performed by positioning a quartz pipette within a few hundred microns of the cell of interest.
Figure 2
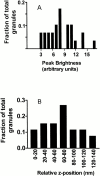
Histogram of Granule Brightness. (A) Peak intensities of granules obtained from consecutive confocal images expressed as fraction of total granules analyzed (n = 29 granules from two cells). (B) The peak intensities of granules from A, converted here to “relative z positions,” placed into bins of 20-nm width, and expressed as fraction of total granules analyzed (n = 29 granules). The conversion assumes that the intrinsically brightest granules in the histogram would be reported at a (presumably correct) z distance z 0 by the IDL granule identification program, while intrinsically dimmer granules would be (incorrectly) reported to reside at a larger z distance z 1. The difference (z 1 − z 0) is the relative z position plotted as the abscissa here.
Figure 4
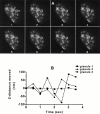
Granule motion in z plane can be quantitated from changes in fluorescence intensity. (A) Images were taken every 0.5 s for 2 min under basal conditions. Three granules were selected and their movement was monitored over time. The intensities of each granule changed over time, indicating movement back and forth in the z direction. (B) Changes in fluorescence intensity have been converted into the absolute value of changes in distance in nanometers the granule moves every 0.5 s.
Figure 5
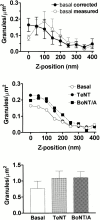
Concentration of granules versus z. The number of granules residing within a particular z position window inferred from their fluorescence intensities. (A) Basal cells. (•) The dependence after correction for intrinsic brightness variations, as described in Materials and Methods; (○) the uncorrected data for which the abscissa is based directly on . Values for uncorrected data are mean ± SEM, n = 9 cells; uncertainties for corrected data are derived as described in Materials and Methods. (B) Cells cotransfected with ANP-GFP and either TeNT or BoNT/A, compared with those transfected with ANP-GFP alone (the same as basal from A) (n = 8, 10, and 10 for TeNT, BoNT/A, and basal, respectively). These are all corrected for intrinsic brightness variations. (C) The number of granules in TIR was counted and the area of the cells in TIR was calculated. Granule density (granules/μm2) was 0.76 ± 0.23 for control cells (n = 10 cells), 1.08 ± 0.22 for cells expressing TeNT (n = 8 cells), and 1.10 ± 0.2 for cells expressing BoNT/A (n = 10 cells) (mean ± SEM).
Figure 7
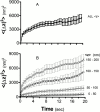
Long-term granule motion: <(Δ_z_)2> versus t. The squared z distance (mean ± SEM) that individually tracked granules in basal cells moved from their initial position is plotted for each cumulative elapsed time point (0.5-s intervals) over the course of 2 min. Only granules that could be followed for at least 40 consecutive frames (20 s) were selected for analysis (128 granules total from 12 cells). (A) All such granules, regardless of z position. (B) Granules divided into pools based on their (uncorrected) z positions (averaged over all the frames in which each was tracked), as estimated from their intensities based on . The pools shown are the following: 0–50, 50–100, 100–150, and 150–200 nm (shown in thin lines). The plots are generally concave down rather than straight, showing that the motion at all z positions is confined, relative to free Brownian diffusion.
Figure 6
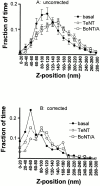
Fraction of visiting time versus z. For granules that can be continually tracked over at least 40 frames and that covered a total distance of at least 100 nm during this time, the fraction of the number of frames that the granule resides within a particular z-position window is plotted versus z position (divided into 20-nm-wide bins). Values are the mean ± SEM for basal cells (57 granules from 12 cells), TeNT expressing cells (54 granules from six cells), and BoNT/A-expressing cells (149 granules from eight cells). (A) These plots are uncorrected for variations in intrinsic brightness; the abscissa is based directly on . (B) These plots are corrected for variations in intrinsic brightness as described in Materials and Methods.
Figure 8
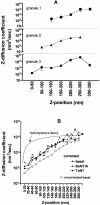
Rates of granule motion versus z position. (A) Three typical individual granules are tracked by imaging at 0.5-s intervals for 120 s. As each granule visits the indicated z range (as judged by intensity data and ), it displays particular z steps Δ_z_. For each z range visited, the (Δ_z_)2 values are averaged separately for each granule, and a local “diffusion coefficient” is calculated according to . Values for each bin are the mean ± SEM. These three plots show a clear tendency of individual granules to greatly slow their motions (note the log scale of the ordinate) as they approach the membrane (smaller z). (B) All granules appearing in at least two consecutive frames as identified by the IDL program are tracked here. The (Δ_z_)2 values from all the steps of all the granules are pooled together according to the indicated z ranges, and the values within each pool are then averaged. The result is converted to a local diffusion coefficient Δ_z_ according to . Values are the mean ± SEM. Several plots are shown here. First, Δ_z_ for basal cells (○) is plotted against z values that are not corrected for expected variations in intrinsic granule brightness. In a second group, Δ_z_ is plotted against z values that are corrected for intrinsic granule brightness variations, according to the procedure described in Materials and Methods. This second group shows separate plots for: basal cells (•, 12 cells, and 21,090 individual motions, where each point the average of 383–2,934 motions), cells expressing TeNT (▪, six cells, and 9,665 individual motions, where each point is the average of 36–2,060 motions), and cells expressing BoNT/A (▴, eight cells, and 17,938 individual motions, where each point is the average of 64–2,761 motions). These plots all show that Δ_z_ smoothly increases with z, with no evidence of discrete steps. The dashed line with no data points is a plot of Δ_z_ versus z based on the hydrodynamic theory of Brenner 1961. This is the expected behavior of a 300-nm diameter sphere near a planar surface in an otherwise homogeneous viscous medium. The absolute scale of the theoretical Δ_z_ is adjusted to match the approximate experimental Δ_z_ values at z = 300 nm. The shape of the theoretical curve is clearly very different from the experimental curves.
Figure 9
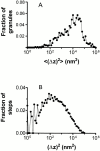
Histograms of step sizes. (A) For each granule that could be tracked for at least five consecutive frames (997 granules from 12 cells), <(Δ_z_)2> was computed from an average of each interframe step size for that granule, and then allocated into bins of 100.1 width on a log scale of <(Δ_z_)2>. Note that the absolute magnitudes shown on the abscissa can also be read as diffusion coefficients in view of , where the interframe time T = 0.5 s. (B) For all granules appearing in at least two consecutive frames (12 cells, 21,530 individual granule motions), all the individual (Δ_z_)2 values were pooled (regardless of their granule of origin), and then allocated into bins of 100.1 width on a log scale of (Δ_z_)2. Both of these histograms show that there are no distinct groups of slow and fast granules, but rather a broad continuum.
Figure 10
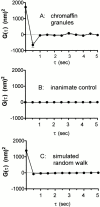
Autocorrelation of granule velocities. For each granule tracked in two or more consecutive frames, the time sequence of Δ_z_ displacements were autocorrelated as in Materials and Methods. The graphs show the mean ± SEM of G(τ) for: (A) granules in basal cells (128 granules from 12 cells), (B) constant intensity light scattering produced by immobile dust particles on a glass coverslip illuminated by an incoherent steady light source (i.e., flashlight), as a test for possible artifactual correlations generated by the instrumentation, and (C) simulated motion of 8,000 “granules” obtained using a random number generator, with the average <(Δ_z_)2> adjusted to match the experimental granule results. Basal and stimulated granules show a tendency (more than would be expected from pure diffusion or a random walk) to reverse direction in the displacement of one interframe step to the next.
Similar articles
- Motion matters: secretory granule motion adjacent to the plasma membrane and exocytosis.
Allersma MW, Bittner MA, Axelrod D, Holz RW. Allersma MW, et al. Mol Biol Cell. 2006 May;17(5):2424-38. doi: 10.1091/mbc.e05-10-0938. Epub 2006 Mar 1. Mol Biol Cell. 2006. PMID: 16510523 Free PMC article. - Visualization of regulated exocytosis with a granule-membrane probe using total internal reflection microscopy.
Allersma MW, Wang L, Axelrod D, Holz RW. Allersma MW, et al. Mol Biol Cell. 2004 Oct;15(10):4658-68. doi: 10.1091/mbc.e04-02-0149. Epub 2004 Jul 28. Mol Biol Cell. 2004. PMID: 15282339 Free PMC article. - Secretory granules: and the last shall be first..
Solimena M, Gerdes HH. Solimena M, et al. Trends Cell Biol. 2003 Aug;13(8):399-402. doi: 10.1016/s0962-8924(03)00150-8. Trends Cell Biol. 2003. PMID: 12888291 - Localization of phosphatidylinositol 4,5-P(2) important in exocytosis and a quantitative analysis of chromaffin granule motion adjacent to the plasma membrane.
Holz RW, Axelrod D. Holz RW, et al. Ann N Y Acad Sci. 2002 Oct;971:232-43. doi: 10.1111/j.1749-6632.2002.tb04467.x. Ann N Y Acad Sci. 2002. PMID: 12438123 Review. - [Analysis of synaptic neurotransmitter release mechanisms using bacterial toxins].
Doussau F, Humeau Y, Vitiello F, Popoff MR, Poulain B. Doussau F, et al. J Soc Biol. 1999;193(6):457-67. J Soc Biol. 1999. PMID: 10783704 Review. French.
Cited by
- Motion matters: secretory granule motion adjacent to the plasma membrane and exocytosis.
Allersma MW, Bittner MA, Axelrod D, Holz RW. Allersma MW, et al. Mol Biol Cell. 2006 May;17(5):2424-38. doi: 10.1091/mbc.e05-10-0938. Epub 2006 Mar 1. Mol Biol Cell. 2006. PMID: 16510523 Free PMC article. - TIRF imaging of docking and fusion of single insulin granule motion in primary rat pancreatic beta-cells: different behaviour of granule motion between normal and Goto-Kakizaki diabetic rat beta-cells.
Ohara-Imaizumi M, Nishiwaki C, Kikuta T, Nagai S, Nakamichi Y, Nagamatsu S. Ohara-Imaizumi M, et al. Biochem J. 2004 Jul 1;381(Pt 1):13-8. doi: 10.1042/BJ20040434. Biochem J. 2004. PMID: 15128287 Free PMC article. - Dynamic motions of molecular motors in the actin cytoskeleton.
Jung W, Tabatabai AP, Thomas JJ, Tabei SMA, Murrell MP, Kim T. Jung W, et al. Cytoskeleton (Hoboken). 2019 Nov;76(11-12):517-531. doi: 10.1002/cm.21582. Epub 2019 Dec 9. Cytoskeleton (Hoboken). 2019. PMID: 31758841 Free PMC article. - The F-actin cortex in chromaffin granule dynamics and fusion: a minireview.
Villanueva J, Torregrosa-Hetland CJ, García-Martínez V, del Mar Francés M, Viniegra S, Gutiérrez LM. Villanueva J, et al. J Mol Neurosci. 2012 Oct;48(2):323-7. doi: 10.1007/s12031-012-9718-4. Epub 2012 Feb 15. J Mol Neurosci. 2012. PMID: 22350991 Review. - Synaptobrevin2 is the v-SNARE required for cytotoxic T-lymphocyte lytic granule fusion.
Matti U, Pattu V, Halimani M, Schirra C, Krause E, Liu Y, Weins L, Chang HF, Guzman R, Olausson J, Freichel M, Schmitz F, Pasche M, Becherer U, Bruns D, Rettig J. Matti U, et al. Nat Commun. 2013;4:1439. doi: 10.1038/ncomms2467. Nat Commun. 2013. PMID: 23385584
References
- Axelrod D. Total internal reflection fluorescence microscopy. In: Periasamy A., editor. Methods in Cellular Imaging. American Physiological Society Book Series, Oxford University Press; Oxford, UK: 2001. pp. 362–380.
- Bajjalieh S.M., Scheller R.H. The biochemistry of neurotransmitter secretion. J. Biol. Chem. 1995;270:1971–1974. - PubMed
- Bittner M.A., DasGupta B.R., Holz R.W. Isolated light chains of botulinum neurotoxins inhibit exocytosisstudies in digitonin-permeabilized chromaffin cells. J. Biol. Chem. 1989;264:10354–10360. - PubMed
- Brenner H. The slow motion of a sphere through a viscous fluid towards a plane surface. Chem. Eng. Sci. 1961;16:242–251.
Publication types
MeSH terms
Substances
Grants and funding
- R01 DK27959/DK/NIDDK NIH HHS/United States
- T32 GM007767/GM/NIGMS NIH HHS/United States
- R01 DK50127/DK/NIDDK NIH HHS/United States
- R01 NS32385/NS/NINDS NIH HHS/United States
- 5T32GM07767/GM/NIGMS NIH HHS/United States
- NS38129/NS/NINDS NIH HHS/United States
- 5F31MH12081/MH/NIMH NIH HHS/United States
- R01 NS032385/NS/NINDS NIH HHS/United States
- R01 DK050127/DK/NIDDK NIH HHS/United States
- R01 NS038129/NS/NINDS NIH HHS/United States
- F31 MH012081/MH/NIMH NIH HHS/United States
LinkOut - more resources
Full Text Sources
Other Literature Sources
Miscellaneous


