A novel human hexameric DNA helicase: expression, purification and characterization - PubMed (original) (raw)
A novel human hexameric DNA helicase: expression, purification and characterization
E E Biswas et al. Nucleic Acids Res. 2001.
Abstract
We have cloned, expressed and purified a hexameric human DNA helicase (hHcsA) from HeLa cells. Sequence analysis demonstrated that the hHcsA has strong sequence homology with DNA helicase genes from Saccharomyces cerevisiae and Caenorhabditis elegans, indicating that this gene appears to be well conserved from yeast to human. The hHcsA gene was cloned and expressed in Escherichia coli and purified to homogeneity. The expressed protein had a subunit molecular mass of 116 kDa and analysis of its native molecular mass by size exclusion chromatography suggested that hHcsA is a hexameric protein. The hHcsA protein had a strong DNA-dependent ATPase activity that was stimulated >/=5-fold by single-stranded DNA (ssDNA). Human hHcsA unwinds duplex DNA and analysis of the polarity of translocation demonstrated that the polarity of DNA unwinding was in a 5'-->3' direction. The helicase activity was stimulated by human and yeast replication protein A, but not significantly by E.coli ssDNA-binding protein. We have analyzed expression levels of the hHcsA gene in HeLa cells during various phases of the cell cycle using in situ hybridization analysis. Our results indicated that the expression of the hHcsA gene, as evidenced from the mRNA levels, is cell cycle-dependent. The maximal level of hHcsA expression was observed in late G(1)/early S phase, suggesting a possible role for this protein during S phase and in DNA synthesis.
Figures
Figure 1
Sequence alignment of hHcsA with yHcsA and C.elegans nHcsA. The polypeptide sequences were aligned by the matchbox server multi-align algorithm. Protein sequence alignments were carried out using the facilities at the Baylor College of Medicine (
http://dot.imgen.bcm.tmc.edu:9331
and
matchbox server). The matched domains shown were predicted as statistically significant. The residues that are identical between the helicases are highlighted in bold.
Figure 2
SDS–PAGE analysis of expression of hHcsAA in E.coli. Induction of expression was carried out as described in the Results in the presence of 0.1 mM IPTG. Equal amounts of cells before and after induction were analyzed by 5–18% SDS–PAGE followed by Coomassie staining. Lane 1, BL21(DE3)/pET29b hHcsA clone #1 cells before induction. Lane 2, BL21(DE3)/pET29b hHcsA clone #1 cells after IPTG induction. Lane 3, BL21(DE3)/pET29b hHcsA clone #6 cells before induction. Lane 4, BL21(DE3)/pET29b hHcsA clone #6 cells after IPTG induction.
Figure 3
Size exclusion HPLC of hHcsA. Fractionation of recombinant helicase on Supadex HR-200 (Pharmacia) column. Gel filtration standards were from Bio-Rad Laboratories (Richmond, CA) and the proteins were as follows: thyroglobulin (670 kDa), bovine γ-globulin (158 kDa), chicken ovalbumin (44 kDa) and equine myoglobin (17 kDa). (A) Analysis of protein concentration of the fractions. (B) SDS–PAGE analysis of the fractions.
Figure 4
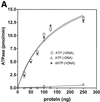
Characterization of the ATPase activity of hHcsA. (A) Protein titration of hHcsA in a standard ATPase/dATPase assay in the presence and absence of 200 pmol of M13mp19 ssDNA. (B) Titration of DNA stimulation of the ATPase activity with oligo(dT)50. (C) Kinetic analysis of the ATPase. ATPase activity (V) versus ATP concentration ([S]) in the presence of 200 pmol of M13mp19 ssDNA. Inset, double reciprocal plot (1/V versus 1/[S]) of the ATPase activity in the presence of 200 pmol M13mp19 ssDNA. The data points represent the mean of three separate experiments with SD ± 4.0%.
Figure 5
In vitro helicase activity of hHcsA expressed in E.coli. (A) A standard helicase assay was carried out utilizing a 50 bp duplex substrate and increasing amounts of purified hHcsA (fraction V). Inhibition at higher protein concentrations was presumably due to salt. (B) Analysis of the polarity of translocation. A time-course analysis of helicase activity (100 ng HcsA fraction III) using the directionality substrate, as described in Materials and Methods, was carried out in the presence of 250 ng RPA. Lanes 1–5 correspond to assay points in which the 30mer duplex is 5′-end-labeled, while lanes 6–10 correspond to assay points in which the 45mer duplex is 3′-end-labeled. Lane 1, 0 min; lane 2, 1 min; lane 3, 2 min; lane 4, 5 min; lane 5, heat denatured substrate labeled at the 30mer duplex end; lane 6, heat denatured substrate labeled at the 45mer duplex end; lane 7, 0 min; lane 8, 1 min; lane 9, 2 min; lane 10, 5 min.
Figure 6
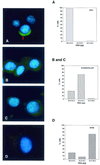
Detection of hHcsA mRNA by FISH. HeLa cells affixed to microslides were probed with oligonucleotide homologous to hHcsA as described in Materials and Methods. The DNA content of the corresponding cell was determined using quantitative Feulgen staining. Based on this, an assignment was made as to the position of a given cell within the cell cycle. Left, images shown are representative of the three categories of signal intensities observed by immunofluorescence microscopy. (A) High level of cross-reactivity; (B and C) moderate to low level of signal intensity; (D) no signal intensities observed. Right, DNA content of the total population of cells for which images were obtained. Based on the quantitative Feulgen staining (29), cells were assigned to phases of the cell cycle as follows: G1, 10.4–12.3; S, 12.3–12.7; G2/M, 12.7–16.6.
Similar articles
- Purification and characterization of DNA polymerase alpha-associated replication protein A-dependent yeast DNA helicase A.
Biswas SB, Chen PH, Biswas EE. Biswas SB, et al. Biochemistry. 1997 Oct 28;36(43):13270-6. doi: 10.1021/bi9712910. Biochemistry. 1997. PMID: 9341217 - Characterization and mutational analysis of the RecQ core of the bloom syndrome protein.
Janscak P, Garcia PL, Hamburger F, Makuta Y, Shiraishi K, Imai Y, Ikeda H, Bickle TA. Janscak P, et al. J Mol Biol. 2003 Jun 27;330(1):29-42. doi: 10.1016/s0022-2836(03)00534-5. J Mol Biol. 2003. PMID: 12818200 - Yeast DNA helicase A: cloning, expression, purification, and enzymatic characterization.
Biswas EE, Fricke WM, Chen PH, Biswas SB. Biswas EE, et al. Biochemistry. 1997 Oct 28;36(43):13277-84. doi: 10.1021/bi971292s. Biochemistry. 1997. PMID: 9341218 - Crystal structure of the hexameric replicative helicase RepA of plasmid RSF1010.
Niedenzu T, Röleke D, Bains G, Scherzinger E, Saenger W. Niedenzu T, et al. J Mol Biol. 2001 Feb 23;306(3):479-87. doi: 10.1006/jmbi.2000.4398. J Mol Biol. 2001. PMID: 11178907 - Analysis of the unwinding activity of the dimeric RECQ1 helicase in the presence of human replication protein A.
Cui S, Arosio D, Doherty KM, Brosh RM Jr, Falaschi A, Vindigni A. Cui S, et al. Nucleic Acids Res. 2004 Apr 19;32(7):2158-70. doi: 10.1093/nar/gkh540. Print 2004. Nucleic Acids Res. 2004. PMID: 15096578 Free PMC article.
Cited by
- Clinical variability in distal spinal muscular atrophy type 1 (DSMA1): determination of steady-state IGHMBP2 protein levels in five patients with infantile and juvenile disease.
Guenther UP, Handoko L, Varon R, Stephani U, Tsao CY, Mendell JR, Lützkendorf S, Hübner C, von Au K, Jablonka S, Dittmar G, Heinemann U, Schuetz A, Schuelke M. Guenther UP, et al. J Mol Med (Berl). 2009 Jan;87(1):31-41. doi: 10.1007/s00109-008-0402-7. Epub 2008 Sep 18. J Mol Med (Berl). 2009. PMID: 18802676 - Prokaryotic and eukaryotic DNA helicases. Essential molecular motor proteins for cellular machinery.
Tuteja N, Tuteja R. Tuteja N, et al. Eur J Biochem. 2004 May;271(10):1835-48. doi: 10.1111/j.1432-1033.2004.04093.x. Eur J Biochem. 2004. PMID: 15128294 Free PMC article. Review.
References
- Kornberg A. and Baker,T.A. (1992) DNA Replication, 2nd Edn. W.H. Freeman and Co., San Francisco, CA.
- Lebowitz J.H. and McMacken,R. (1986) The Escherichia coli dnaB replication protein is a DNA helicase. J. Biol. Chem., 261, 4738–4748. - PubMed
- Baker T.A., Funnell,B.E. and Kornberg,A. (1987) Helicase action of dnaB protein during replication from the Escherichia coli chromosomal origin in vitro. J. Biol. Chem., 262, 6877–6885. - PubMed
- Bernstein J.A. and Richardson,C.C. (1989) Characterization of the helicase and primase activities of the 63-kDa component of the bacteriphage T7 gene 4 protein. J. Biol. Chem., 264, 13066–13073. - PubMed
- Dong F. and von Hippel,P.H. (1996) The ATP-activated hexameric helicase of bacteriophage T4 (gp41) forms a stable primosome with a single subunit of T4-coded primase (gp61). J. Biol. Chem., 271, 19625–19631. - PubMed
Publication types
MeSH terms
Substances
LinkOut - more resources
Full Text Sources
Molecular Biology Databases


