Ablation of NF1 function in neurons induces abnormal development of cerebral cortex and reactive gliosis in the brain - PubMed (original) (raw)
Ablation of NF1 function in neurons induces abnormal development of cerebral cortex and reactive gliosis in the brain
Y Zhu et al. Genes Dev. 2001.
Abstract
Neurofibromatosis type 1 (NF1) is a prevalent genetic disorder that affects growth properties of neural-crest-derived cell populations. In addition, approximately one-half of NF1 patients exhibit learning disabilities. To characterize NF1 function both in vitro and in vivo, we circumvent the embryonic lethality of NF1 null mouse embryos by generating a conditional mutation in the NF1 gene using Cre/loxP technology. Introduction of a Synapsin I promoter driven Cre transgenic mouse strain into the conditional NF1 background has ablated NF1 function in most differentiated neuronal populations. These mice have abnormal development of the cerebral cortex, which suggests that NF1 has an indispensable role in this aspect of CNS development. Furthermore, although they are tumor free, these mice display extensive astrogliosis in the absence of conspicuous neurodegeneration or microgliosis. These results indicate that NF1-deficient neurons are capable of inducing reactive astrogliosis via a non-cell autonomous mechanism.
Figures
Figure 1
Generation of NF1 flox mice. (A) Schematic of the wild-type (WT) NF1 allele, targeting vector, and the flox allele. A loxP site with the pGKneo cassette was inserted into intron 30, and the second loxP site was introduced into intron 32. In this manner, exons 31 and 32 of the NF1 gene are flanked by two loxP sites. A 5′ external probe (probe A) and a 3′ internal probe (probe B) for Southern analysis are shown. P, _Pst_I; H, _Hin_dIII; R, _Eco_RI. (B) (Left panel) Southern analysis with 5′ probe (probe A) shows a mutant (left lane) and a WT (right lane) ES clones. The mutant allele produces a 10.2-kb fragment; the WT allele produces an 11.8-kb fragment. (Right panel) Genomic DNA from the same ES clones hybridized with 3′ probe (probe B), confirming that the mutant ES clone has undergone homologous recombination in the NF1 locus. The mutant allele produces a 1.2-kb fragment; the WT allele produces a 3.2-kb fragment. (C) Southern analysis with the probes (as described above) on the littermates of NF1flox/+ intercross. (D) Southern analysis with 3′ probe shows different alleles of the NF1 gene: WT allele (3.2 kb), knockout (KO) allele (2.6 kb), and flox allele (1.2 kb). These mice were subjected to survival study. (E) Survival curve of NF1flox/flox and flox/KO mice. It shows the normal survival profile of NF1 flox allele. (F) A representative E13.5 NF1KO/Δ and WT littermate.
Figure 2
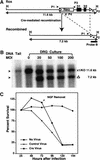
NF1−/− neurons generated by Cre-mediated recombination survive in the absence of neurotrophins. (A) Schematic drawing of the NF1flox allele and the recombined allele resulted from Cre-mediated recombination. Southern analysis with 3′ probe (probe B) produces an 11.6-kb fragment from the flox allele and knockout (KO) allele, and a 7.2-kb fragment from the recombined (Δ) allele. Thus, the flox allele and recombined flox allele (Δ) can be distinguished by Southern analysis. Positions of primers (P1, P2, P3, and P4) are illustrated. The combination of P1, P3, and P4 primers is used to genotype NF1flox mice; the pair of P1 and P2 primers (R-Cre PCR) is used to detect Cre-mediated recombination, P1 and P4 primers are used to detect the presence of the flox allele (flox-PCR; see Materials and Methods). H, _Hin_dIII. (B) Southern analysis of NF1flox/KO dorsal root ganglion (DRG) after exposure to Cre-adenovirus. Genomic DNA from NF1flox/KO DRG cultures infected with Cre-adenovirus were hybridized with probe B. The multiplicity of infection (MOI) of each culture is illustrated. Of note, in this restriction analysis (_Hin_dIII), the KO allele produces a similar fragment (11.6 kb) as the flox allele. DRG cultures with MOI > 20 underwent complete deletion: The 11.6 kb band represents the KO allele; the 7.2-kb band represents the deleted (Δ) allele after Cre-mediated recombination. (C) Neurotrophin survival assay on E13.5 DRG cultures from NF1 flox/KO or flox/flox E13.5 embryos. Cultures were either mock infected or subjected to LacZ-, and Cre-adenovirus for 3 d in the presence of NGF (10 ng/mL). NGF was then removed by dilution of medium and addition of anti-NGF antibody. Cell counts were performed every 24 h for 5 d after plating. The results represent the mean of three independent experiments.
Figure 3
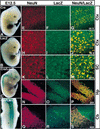
Characterization of Synapsin I–Cre transgene (Tg) expression. E12.5 embryos (A) Cre Tg, (B) LacZ Tg, (C) and (D) Cre/LacZ double Tg were subjected to LacZ staining. Only the compound transgenic mice exhibit Cre-mediated activation of the β-galactosidase gene. Double-labeling immunoanalysis of Cre/LacZ double Tg with anti-NeuN and anti-LacZ antibodies for the cortex (E–J); spinal cord (K–M); hippocampus (N–P); and cerebellum (Q–S). Colocalization of LacZ and NeuN signals indicates that Cre-mediated recombination specifically occurs in differentiated neurons. Of note, the neuronal marker, NeuN is not expressed in the Purkinje cells. Ctx, cortex; SC, spinal cord; Hp, hippocampus; and Cb, cerebellum. Objective magnification: E_–_G and N_–_P, 20×; H_–_M and Q_–_S, 40×.
Figure 4
NF1SynIKO mice lose neurofibromin immunoreactivity in most neuronal populations. (A_–_D) Anti-NF1 immunoreactivity in the cortex (Ctx), cerebellum (Cbx), and spinal cord (SC) of control mice showing dark staining of neurons. (E_–_H) Loss of NF1 staining in the majority of neuronal populations in the mutant mice. An exception, however, is a subset of the Purkinje neurons in the Cbx (G), which retain NF1 immunoreactivity. A–C are from the same section, as are E–G. Scale bar, 50 μm.
Figure 5
NF1SynIKO astrocytes do not express Cre recombinase. Double immunoanalysis with anti-LacZ/GFAP (A,C) and anti-Cre/GFAP (B,D). In the CA2/3 regions (A) and dentate gyrus (DG) (C) of the hippocampus, most of LacZ positive cells are localized in the neuronal layer with big nuclei. Of note, the inset shows the relative size of neuronal and small astrocytic nuclei and examples of colocalization of LacZ and glial fibrillary acidic protein (GFAP) signals. The arrow in A points out the apparent colocalization of LacZ and GFAP signals, which is actually the result of independent cells on two planes of the 50 μm section. (C) Some red nuclei are visible outside the DG. These are large nuclei that do not overlap with GFAP and likely represent interneuron nuclei. (D) High magnification of B, showing that Cre-positive cells are not GFAP positive. Scale bar, 50 μm.
Figure 6
NF1SynIKO mice have reduced cerebral cortex thickness and increased cell density. Serial coronal sections of brains from control and mutant littermates were cut at 50 μm and analyzed by hematoxylin and eosin (H&E) staining, NeuN, MAP2, and Golgi staining. (A,E) Control cortex, H&E; (B,F) mutant cortex, H&E; (C,G) control cortex, NeuN; (D,H) mutant cortex, NeuN; the reduced cortical thickness is readily apparent in the mutant cortex. (I) Control cortex, MAP2; (J) mutant cortex, MAP2, arrows point out the presence of MAP2-positive pyramidal neurons in the mutant cortex; (K) control and (L) mutant cortex, Golgi stain. The morphology of the stained neurons appeared normal in the mutant cortex. Scale bar, 50 μm.
Figure 7
Increased cell density in the cerebral cortex of NF1SynIKO mice. Anterior-to-posterior morphometric analysis of the secondary somatosensory cortex (S2 Ctx) revealed a significant reduction in cortical thickness in NF1SynIKO mice compared to control (CTR) animals. The reduction was significant particularly at caudal levels; −0.94 (P < 0.05), −1.46, and −1.94 (P < 0.01) mm from Bregma (A). A comparison of the average cortical thickness in these mice showed an ∼20% decrease (P < 0.05) in the NF1SynIKO mice (B). Despite the reduced cortical thickness in mutant mice, the rest of the brain size is comparable to that in CTR mice. Measurement of the horizontal brain length, excluding the cortex (H-Ctx) in mutant mice showed no significant differences throughout the anterior-to-posterior axis when compared to CTR mice (C). Quantitative analysis of the total number of cells in the cortex failed to demonstrate any differences because of genotype (D). *, P < 0.05; **, P < 0.01.
Figure 8
NF1SynIKO mice display extensive astrogliosis. Serial coronal sections were cut at 50 μm thickness (cryostat) or 5 μm thickness (paraffin), and subjected to GFAP immunoanalysis. (A_–_D) Four sections from rostral to caudal, with the left hemispheres in each panel from control mice and the right hemispheres from mutant mice. Note the overall darker brown staining in the right hemispheres, indicating extensive astrogliosis in the mutant brains. (E_–_H) High magnification of the control cortex (the boxed area of the left hemisphere in A_–_D). (I_–_L) High magnification of the mutant cortex (the boxed area of the right hemisphere in A_–_D). (M_–_O) Control and (R_–_T) mutant hippocampus. Note the hypertrophic nature of the reactive astrocytes (compare T to O). Control (P,Q) and mutant (U,V) brainstem. Scale bar: A_–_D, 1 mm; E_–_V, 50 μm.
Figure 9
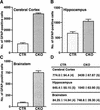
The number of glial fibrillary acidic protein (GFAP)-positive cells is significantly increased in the mutant brains. The quantification of GFAP-positive cells in the cortex (A), hippocampus (B), and brainstem (C). (D) Mean value ± SEM (number of brains examined).
Figure 10
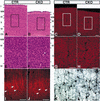
Activation of MAP kinase in NF1SynIKO neurons. (A) (Top panel) Western blot analysis of tissues from different parts of control and mutant brains using anti-phosphorylated erk (P-erk) antibody. (Bottom panel) The same blot was stripped and reprobed with anti-P-erk antibody as a loading control. (B) P-erk and erk signals were quantified by densitrometry (see Materials and Methods). The level of P-erk in each sample is normalized to level of erk protein signal. Each number represents mean value ± standard error of the mean (SEM) of ratio of P-erk levels of three mutants to three controls. Sections of cerebral cortex from control (C) and mutant mice (D) were analyzed with anti-P-erk antibody. The mutant cortex exhibits greater number of phospho-erk positive cells corresponding to neurons and not to reactive astrocytes. E and G are high magnification of the top and bottom boxed area of C; F and H are high magnification of the top and bottom boxed area of D. Ctx, cerebral cortex; Hp, hippocampus; Bs, brainstem; Cb, cerebellum; CC, corpus callosum. Scale bar, 100 μm.
Similar articles
- Schwann cells from neurofibromin deficient mice exhibit activation of p21ras, inhibition of cell proliferation and morphological changes.
Kim HA, Rosenbaum T, Marchionni MA, Ratner N, DeClue JE. Kim HA, et al. Oncogene. 1995 Jul 20;11(2):325-35. Oncogene. 1995. PMID: 7624147 - Neurofibromin expression and astrogliosis in neurofibromatosis (type 1) brains.
Nordlund ML, Rizvi TA, Brannan CI, Ratner N. Nordlund ML, et al. J Neuropathol Exp Neurol. 1995 Jul;54(4):588-600. doi: 10.1097/00005072-199507000-00013. J Neuropathol Exp Neurol. 1995. PMID: 7602332 - Astrocyte-specific inactivation of the neurofibromatosis 1 gene (NF1) is insufficient for astrocytoma formation.
Bajenaru ML, Zhu Y, Hedrick NM, Donahoe J, Parada LF, Gutmann DH. Bajenaru ML, et al. Mol Cell Biol. 2002 Jul;22(14):5100-13. doi: 10.1128/MCB.22.14.5100-5113.2002. Mol Cell Biol. 2002. PMID: 12077339 Free PMC article. - Neurofibromatosis type 1: II. Answers from animal models.
Lakkis MM, Tennekoon GI. Lakkis MM, et al. J Neurosci Res. 2001 Aug 1;65(3):191-4. doi: 10.1002/jnr.1142. J Neurosci Res. 2001. PMID: 11494353 Review. No abstract available. - NF1 and Neurofibromin: Emerging Players in the Genetic Landscape of Desmoplastic Melanoma.
Mahalingam M. Mahalingam M. Adv Anat Pathol. 2017 Jan;24(1):1-14. doi: 10.1097/PAP.0000000000000131. Adv Anat Pathol. 2017. PMID: 27941538 Review.
Cited by
- Oncogenic Kras expression in postmitotic neurons leads to S100A8-S100A9 protein overexpression and gliosis.
Ryu MJ, Liu Y, Zhong X, Du J, Peterson N, Kong G, Li H, Wang J, Salamat S, Chang Q, Zhang J. Ryu MJ, et al. J Biol Chem. 2012 Jun 29;287(27):22948-58. doi: 10.1074/jbc.M112.357772. Epub 2012 May 10. J Biol Chem. 2012. PMID: 22577135 Free PMC article. - Motor and Sensory Deficits in the teetering Mice Result from Mutation of the ESCRT Component HGS.
Watson JA, Bhattacharyya BJ, Vaden JH, Wilson JA, Icyuz M, Howard AD, Phillips E, DeSilva TM, Siegal GP, Bean AJ, King GD, Phillips SE, Miller RJ, Wilson SM. Watson JA, et al. PLoS Genet. 2015 Jun 26;11(6):e1005290. doi: 10.1371/journal.pgen.1005290. eCollection 2015 Jun. PLoS Genet. 2015. PMID: 26115514 Free PMC article. - Syndrome-Specific Neuroanatomical Phenotypes in Girls With Turner and Noonan Syndromes.
Siqueiros-Sanchez M, Rai B, Chowdhury S, Reiss AL, Green T. Siqueiros-Sanchez M, et al. Biol Psychiatry Cogn Neurosci Neuroimaging. 2024 Feb;9(2):146-155. doi: 10.1016/j.bpsc.2022.08.012. Epub 2022 Sep 7. Biol Psychiatry Cogn Neurosci Neuroimaging. 2024. PMID: 36084900 Free PMC article. - PTEN dosage is essential for neurofibroma development and malignant transformation.
Gregorian C, Nakashima J, Dry SM, Nghiemphu PL, Smith KB, Ao Y, Dang J, Lawson G, Mellinghoff IK, Mischel PS, Phelps M, Parada LF, Liu X, Sofroniew MV, Eilber FC, Wu H. Gregorian C, et al. Proc Natl Acad Sci U S A. 2009 Nov 17;106(46):19479-84. doi: 10.1073/pnas.0910398106. Epub 2009 Oct 21. Proc Natl Acad Sci U S A. 2009. PMID: 19846776 Free PMC article. - Aberrant growth and differentiation of oligodendrocyte progenitors in neurofibromatosis type 1 mutants.
Bennett MR, Rizvi TA, Karyala S, McKinnon RD, Ratner N. Bennett MR, et al. J Neurosci. 2003 Aug 6;23(18):7207-17. doi: 10.1523/JNEUROSCI.23-18-07207.2003. J Neurosci. 2003. PMID: 12904481 Free PMC article.
References
- Baba H, Fuss B, Urano J, Poullet P, Watson JB, Tamanoi F, Macklin WB. GapIII, a new brain-enriched member of the GTPase-activating protein family. J Neurosci Res. 1995;41:846–858. - PubMed
- Ballester R, Marchuk D, Boguski M, Saulino A, Letcher R, Wigler M, Collins F. The NF1 locus encodes a protein functionally related to mammalian GAP and yeast IRA proteins. Cell. 1990;63:851–859. - PubMed
- Basu TN, Gutmann DH, Fletcher JA, Glover TW, Collins FS, Downward J. Aberrant regulation of ras proteins in malignant tumour cells from type 1 neurofibromatosis patients. Nature. 1992;356:713–715. - PubMed
- Boguski MS, McCormick F. Proteins regulating Ras and its relatives. Nature. 1993;366:643–654. - PubMed
- Bollag G, Clapp DW, Shih S, Adler F, Zhang YY, Thompson P, Lange BJ, Freedman MH, McCormick F, Jacks T, et al. Loss of NF1 results in activation of the Ras signaling pathway and leads to aberrant growth in haematopoietic cells. Nat Genet. 1996;12:144–148. - PubMed
Publication types
MeSH terms
Substances
Grants and funding
- R01 DK048247/DK/NIDDK NIH HHS/United States
- R01 NS034296/NS/NINDS NIH HHS/United States
- DK 48247/DK/NIDDK NIH HHS/United States
- R01-NS34296-05/NS/NINDS NIH HHS/United States
LinkOut - more resources
Full Text Sources
Other Literature Sources
Molecular Biology Databases
Research Materials
Miscellaneous


