Chimera analysis of the Clock mutation in mice shows that complex cellular integration determines circadian behavior - PubMed (original) (raw)
Chimera analysis of the Clock mutation in mice shows that complex cellular integration determines circadian behavior
S S Low-Zeddies et al. Cell. 2001.
Abstract
The Clock mutation lengthens periodicity and reduces amplitude of circadian rhythms in mice. The effects of Clock are cell intrinsic and can be observed at the level of single neurons in the suprachiasmatic nucleus. To address how cells of contrasting genotype functionally interact in vivo to control circadian behavior, we have analyzed a series of Clock mutant mouse aggregation chimeras. Circadian behavior in Clock/Clock <--> wild-type chimeric individuals was determined by the proportion of mutant versus normal cells. Significantly, a number of intermediate phenotypes, including Clock/+ phenocopies and novel combinations of the parental behavioral characteristics, were seen in balanced chimeras. Multivariate statistical techniques were used to quantitatively analyze relationships among circadian period, amplitude, and suprachiasmatic nucleus composition. Together, our results demonstrate that complex integration of cellular phenotypes determines the generation and expression of coherent circadian rhythms at the organismal level.
Figures
Figure 1. Clock Chimera Genotypic Components
(A) Construction of Clock chimeras. Crosses are performed to produce two classes of embryo that differ in coat color, Clock genotype, and presence or absence of a LacZ cell marker. Embryos of contrasting genotype are fused to form a chimeric blastocyst that develops into a chimeric mouse, identifiable by its variegated coat color. Testing of circadian behavior is followed by SCN histological analysis. The bilaterally paired SCN is indicated by yellow arrows. (B) Component strain controls. The three genetic differences between component embryos are illustrated. Examples of pigmented and albino coat colors are shown. Examples of control SCN are also shown, in which all of the cells are either LacZ positive (blue) or LacZ negative. Activity records show examples of circadian behavioral phenotypes for both component genotypes (WT and Clock/Clock), as well as a Clock heterozygote genetic control (F1) for comparison. All activity records are displayed double plotted on a 24 hr scale. Days of activity recording are indicated on the vertical axis. All mice in this study were exposed to an identical lighting schedule, which is encoded by the colored bar to the left: yellow represents LD 12:12, black represents DD, yellow arrows represent CT17–23 light pulses. Fourier analyses of circadian amplitude (relative power spectral density; rPSD), applied to the 20 days interval between the two light pulses, show a clear peak at one cycle/day for the WT and Clock/+ mice, but not in the arrhythmic Clock/Clock mouse. The peaks of the X2 periodogram analyses for the same interval identify the dominant circadian periods for the WT and Clock/+ mice; the Clock/Clock activity record lacks a detectable circadian periodicity.
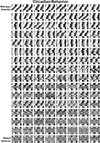
Figure 2
Clock Chimeras Show a Range of Circadian Behavioral Phenotypes Activity records are arranged from left to right, top to bottom, showing more subjectively WT-like to more mutant-like behavior. We initially ranked phenotypic traits according to a sequence of progressive mutant severity that we have observed in Clock heterozygotes and homozygotes on various genetic backgrounds. Mutant phenotypes tend to escalate from aberrant responses to light pulses, to period lability, amplitude instability, sustained period changes, and finally, to a loss of circadian rhythmicity. Guided by these criteria, we qualitatively ordered the activity records in this panel according to the degree to which we judged their activity to be WT-like versus Clock mutant-like. Behaviorally equivalent individuals were ordered by date of birth.
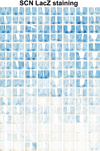
Figure 3. SCN of Clock/Clock Chimeras Show a Gradient of LacZ-Positive (WT) Cells when Ordered by Circadian Behavioral Phenotype
A single, central section through the SCN of each chimera is shown; chimeric individuals are represented in the same order and configuration as in Figure 2. Notably aberrant cases of SCN LacZ staining: row 10 column 5, row 11 columns 4 and 5, row 13 column 7, row 16 columns 3 and 8. Figures 2 and 3 (and Supplemental Figures S3–S5 on the Cell web-site) show data from 128 Clock/Clock chimeras; 9 individuals were excluded due to premature death or inadequate histological processing.
Figure 4. Examples of Circadian Behavior in Clock/Clock Chimeras
(A) Phenocopies of Clock/+mice. Clock/Clock chimeras can show circadian behavior indistinguishable from that of Clock heterozygotes (example in Figure 1B). (B) Stable intermediate period lengths. Data shown is in DD5; periodogram analyses for intervals shown indicate the dominant periodicity. (C) Lability of circadian period and amplitude. (D) Phase shifts in Clock/Clock chimeras are larger relative to period length and amplitude compared to control mice. Only data from animals with measurable periods flanking light pulses were used (based on error of line-fit measures 2.5). Phase shifts 1 and 2 are displayed together. (E) Light pulses can temporarily destabilize wild-type-like rhythmicity. (F) Short period, low-amplitude rhythmicity.
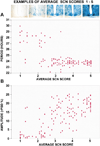
Figure 5. Circadian Period Is Shorter and Amplitude Is Higher with More LacZ-Positive (WT) Cells
Examples of SCN representing each average score from 1 to 5 are shown. Both free-running period in DD4 (A) and circadian amplitude (rPSD) in DD1 (B) are correlated with the average of 12 regional SCN LacZ-staining scores (period R2 =−0.72; amplitude R2 = 0.72).
Figure 6. Principal Components Analyses
(A) A principal components factor loading plot shows that circadian period and circadian amplitude measures share little common variance in Clock/Clock chimeras. (B) A principal components factor for amplitude plotted against a factor for period permits comparison of multiple dimensions of Clock/Clock chimera behavior with control genotypic groups. The plot demonstrates that chimera scores are distributed beyond the ranges of the control groups, reflecting novel period-amplitude combinations among chimeras. Sample ellipses p =0.683. (C) Principal components analysis of Clock/ Clock chimera data indicates that amplitude shares more common variance with regional SCN scores than does period. The plot suggests that amplitude is more related than is period to SCN cellular composition. (D) A plot of a circadian behavior (period-amplitude) factor by an SCN LacZ-staining factor shows that the two are correlated in Clock/Clock chimeras: R2 =−0.72.
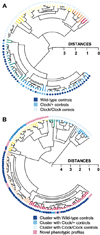
Figure 7. Cluster Analysis of Controls and Chimeras
Complete linkage hierarchical cluster analysis was used, based on all 7 measures of circadian period and amplitude in DD: TAUDD1A, TAUDD1B, TAUDD2, TAUDD3, TAUDD4, FFTDD1, FFTDD4 (in the cluster tree, branch color changes by 0.25 distance metric length of terminal nodes). (A) Cluster analysis performed on control groups demonstrates the effectiveness of the procedure for sorting multidimensional behavioral phenotypes. The Clock genotypes of the control mice are indicated by the colored dots. The appearance of the cluster of Clock/+ controls amidst the WT controls is an artifact of the way the statistical program positioned the branches of the dendrogram (at each bifurcation of the dendrogram, the position of the clusters can be reversed). (B) Novel and Clock/+-like phenotypes are quantitatively detected among Clock/Clock chimeras using cluster analysis. The colored dots indicate the control genotype with which each chimera clustered most closely (within a 0.5 distance metric, in a separate cluster analysis combining chimeras and controls).
Figure 8
Novel and Mixed Phenotypes of Clock/Cloc_k_ Chimeras Annotated on a Cluster Analysis of Regional SCN Scores Single linkage hierarchical cluster analysis was used. The cluster tree diagram for the cellular genotype distribution patterns is on the vertical axis of the matrix. SCN LacZ staining increases from the top to the bottom—scores 1–5 indicate fewer to more WT cells. Cluster analysis applied to the 12 SCN regional variables is shown in the dendrogram on the horizontal axis of the matrix. Abbreviations for SCN regions: D = dorsal, V = ventral, L = left, R = right, A = anterior, M = medial, P = posterior. Instances of chimeras that behave as Clock heterozygote phenocopies, animals that show labile rhythmicity, and those that exhibit the short, low-amplitude mixed phenotype are annotated to the left of the matrix.
Similar articles
- Clock mutation lengthens the circadian period without damping rhythms in individual SCN neurons.
Nakamura W, Honma S, Shirakawa T, Honma K. Nakamura W, et al. Nat Neurosci. 2002 May;5(5):399-400. doi: 10.1038/nn843. Nat Neurosci. 2002. PMID: 11953751 - Effects of age on circadian rhythms are similar in wild-type and heterozygous Clock mutant mice.
Kolker DE, Vitaterna MH, Fruechte EM, Takahashi JS, Turek FW. Kolker DE, et al. Neurobiol Aging. 2004 Apr;25(4):517-23. doi: 10.1016/j.neurobiolaging.2003.06.007. Neurobiol Aging. 2004. PMID: 15013573 Free PMC article. - Circadian rhythms: a fine c(l)ocktail!
Albrecht U. Albrecht U. Curr Biol. 2001 Jul 10;11(13):R517-9. doi: 10.1016/s0960-9822(01)00308-6. Curr Biol. 2001. PMID: 11470424 - Keeping time without a clock.
Collins B, Blau J. Collins B, et al. Neuron. 2006 May 4;50(3):348-50. doi: 10.1016/j.neuron.2006.04.022. Neuron. 2006. PMID: 16675389 Review. - Clock genes of Mammalian cells: practical implications in tissue culture.
Kaeffer B, Pardini L. Kaeffer B, et al. In Vitro Cell Dev Biol Anim. 2005 Nov-Dec;41(10):311-20. doi: 10.1007/s11626-005-0001-7. In Vitro Cell Dev Biol Anim. 2005. PMID: 16448219 Review.
Cited by
- Neural correlates of individual differences in circadian behaviour.
Evans JA, Leise TL, Castanon-Cervantes O, Davidson AJ. Evans JA, et al. Proc Biol Sci. 2015 Jul 7;282(1810):20150769. doi: 10.1098/rspb.2015.0769. Proc Biol Sci. 2015. PMID: 26108632 Free PMC article. - Molecular and Cellular Networks in The Suprachiasmatic Nuclei.
El Cheikh Hussein L, Mollard P, Bonnefont X. El Cheikh Hussein L, et al. Int J Mol Sci. 2019 Apr 25;20(8):2052. doi: 10.3390/ijms20082052. Int J Mol Sci. 2019. PMID: 31027315 Free PMC article. Review. - Development of the mouse suprachiasmatic nucleus: determination of time of cell origin and spatial arrangements within the nucleus.
Kabrita CS, Davis FC. Kabrita CS, et al. Brain Res. 2008 Feb 21;1195:20-7. doi: 10.1016/j.brainres.2007.12.020. Epub 2007 Dec 23. Brain Res. 2008. PMID: 18201688 Free PMC article. - CREB influences timing and entrainment of the SCN circadian clock.
Lee B, Li A, Hansen KF, Cao R, Yoon JH, Obrietan K. Lee B, et al. J Biol Rhythms. 2010 Dec;25(6):410-20. doi: 10.1177/0748730410381229. J Biol Rhythms. 2010. PMID: 21135157 Free PMC article. - Ghrelin-immunopositive hypothalamic neurons tie the circadian clock and visual system to the lateral hypothalamic arousal center.
Horvath TL, Abizaid A, Dietrich MO, Li Y, Takahashi JS, Bass J. Horvath TL, et al. Mol Metab. 2012 Aug 18;1(1-2):79-85. doi: 10.1016/j.molmet.2012.08.003. eCollection 2012. Mol Metab. 2012. PMID: 24024121 Free PMC article.
References
- Aguilar-Roblero R, Morin LP, Moore RY. Morphological correlates of circadian rhythm restoration induced by transplantation of the suprachiasmatic nucleus in hamsters. Exp. Neurol. 1994;130:250–260. - PubMed
- Balling R, Brown S, Hrabe´ de Angelis M, Justice M, Nadeau J, Peters J. Great times for mouse genetics: getting ready for large-scale ENU-mutagenesis. Mamm. Genome. 2000;11:471. - PubMed
- Bouskila Y, Dudek FE. Can a population of suprachiasmatic nucleus neurons with different period lengths produce a stable circadian rhythm? Brain Res. 1995;670:333–336. - PubMed
- Brüstle O, Maskos U, McKay RDG. Host-guided migration allows targeted introduction of neurons into the embryonic brain. Neuron. 1995;15:1275–1285. - PubMed
Publication types
MeSH terms
Substances
LinkOut - more resources
Full Text Sources
Other Literature Sources
Molecular Biology Databases


