Gating of human theta oscillations by a working memory task - PubMed (original) (raw)
Clinical Trial
Gating of human theta oscillations by a working memory task
S Raghavachari et al. J Neurosci. 2001.
Abstract
Electrode grids on the cortical surface of epileptic patients provide a unique opportunity to observe brain activity with high temporal-spatial resolution and high signal-to-noise ratio during a cognitive task. Previous work showed that large-amplitude theta frequency oscillations occurred intermittently during a maze navigation task, but it was unclear whether theta related to the spatial or working memory components of the task. To determine whether theta occurs during a nonspatial task, we made recordings while subjects performed the Sternberg working memory task. Our results show event-related theta and reveal a new phenomenon, the cognitive "gating" of a brain oscillation: at many cortical sites, the amplitude of theta oscillations increased dramatically at the start of the trial, continued through all phases of the trial, including the delay period, and decreased sharply at the end. Gating could be seen in individual trials and varying the duration of the trial systematically varied the period of gating. These results suggest that theta oscillations could have an important role in organizing multi-item working memory.
Figures
Fig. 1.
Schematic of the Sternberg task illustrating a four-item list using the “yes/no” procedure. A series of letters was presented after an orienting cue (+). After a delay period, a probe item was shown. Subjects indicated whether the probe was on the list, and RT was measured. After the response, the probe was turned off, and subjects received feedback on their performance and initiated the next trial by a key press.
Fig. 2.
iEEG data show significant task-related nonstationarity, predominantly in the theta frequency band. To be considered significant, the nonstationarity index must be higher than the horizontal line, which denotes the 99.999% point of the χ2 distribution with the appropriate degrees of freedom (see Materials and Methods). Nonstationarity index Ξ(f) shown for two representative electrodes. a, Subject 1, Talairach coordinates (left–right, anterior–posterior, inferior–superior) are +44, +11, +38. This electrode exhibits significant nonstationarity in the theta and beta bands, as well as some peaks in the 20–30 Hz range. b, Subject 3, Talairach coordinates are −42, +8, +42. This shows an electrode that has no significant peaks. In both cases, the average power spectrum had peaks in the theta frequency range. For a majority of frequencies, the measure is distributed between the 5 and 95% confidence intervals with most values around the theoretical mean value, indicating that the method is appropriate. c, Summary plot of the number of electrodes which showed significant nonstationarity as a function of frequency. A given electrode could show nonstationarity at several different frequencies.
Fig. 3.
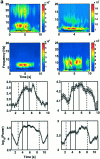
Theta is gated during the Sternberg task.a, Time-frequency energy averaged over all two-item lists shows sustained theta activity. An example is shown from each of the four subjects. The data illustrated were obtained from a right frontal site in subject 1 (Talairach coordinates are +44, +11, +38) (top left); a left temporal site in subject 2 (Talairach coordinates are −42, −9, −10) (top right); a right frontal site (Talairach coordinates are −52, −34, +38) in subject 3 (bottom left); and a depth electrode in left temporal lobe (Talairach coordinates are −25, −72, +6) in subject 4 (bottom right). Black bars in the spectrograms denote the trial duration from the orienting cue to the mean response time for two item lists. Because of limitations in our synchronization techniques and methods of time-frequency analysis, the determination of the onset and offset of theta has a precision of ±200 msec. The color scale represents power in square microvolts. In subject 1, we also observed similar gating centered around 18 Hz. However, because this finding was not duplicated across subjects, we did not analyze it further. b, Evolution of average theta power in time for the above four electrodes for a bandwidth of 4 Hz around the peak frequency. The dot–dashed vertical line marks the orienting cue, the two solid lines denote the list items, and the_dashed line_ denotes the probe. Theta power is elevated throughout the trial, with fluctuations within the trial. The error bars denote the 95% confidence intervals.
Fig. 4.
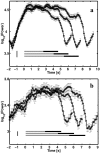
Gating varies systematically with list length. Averaged theta power (5–9 Hz) as a function of time shows that theta is elevated for the entire duration of the trial. The three different traces are averages over trials with two-, three- and four-item lists (circles, squares, and diamonds, respectively). Gray bars mark the presentation of the list items, and the black bars mark the delay interval until the presentation of the probe for the two-, three-, and four-item lists. The large tick at −1 sec marks the onset of the orienting cue.a, Recording from a subdural electrode in the parietal cortex (subject 3, Talairach coordinates are −52, −34, +38).b, Recording from a depth electrode in left temporal lobe (subject 4, Talairach coordinates are −25, −72, +6). The rise subsequent to the end of the trial is attributable to the onset of the next trial.
Fig. 5.
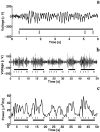
Gating of theta oscillations is evident in single trials of the raw iEEG signal. a, Sample raw iEEG trace recorded from an electrode in the parietal cortex (subject 3, Talairach coordinates are −52, −34, +38) during a two-item list. The_black bar_ below the trace marks the task duration, whereas the ticks denote the presentation of the list items, probe, and response, respectively. b, A 50 sec iEEG trace with five consecutive trials from the same electrode shows clear enhancement in theta activity for the duration of each trial. Bars and_tick marks_ are as above. c, Narrow-band power (7 ± 1 Hz) for the 50 sec trace above shows clear enhancement during trials relative to intertrial intervals.
Fig. 6.
Theta activity not caused by sensory stimulus or motor responses. Averaged spectrogram for a site showing gated theta activity (subject 1, Talairach coordinates are +44, +11, +38). The trials were aligned to the response. The bars marked_Feedback_ and Key denote the sensory stimulus (visual feedback after the response) and the mean time of the motor response to initiate the subsequent trial, respectively. One hundred trials of all list lengths with a mean delay of 1 sec between the response and the key press (to initiate the next trial) were used to compute the spectrogram. Theta activity (∼6 Hz peak frequency) has a sharp offset after the response and stays off until the beginning of the next trial (1.6 sec after the key press). The small increase in theta activity after the key press is caused by averaging trials of different mean intervals between the feedback and key press. The color scale represents power in square microvolts per Hertz.
Fig. 7.
Views of standardized brain showing electrode locations of gated sites. Filled symbols indicate electrodes in which theta was gated “on” by the task. _Open symbols_indicate electrodes that did not meet our significance threshold.Different symbols indicate different subjects.
Fig. 8.
Nearby regions (spacing ∼1–2 cm) can have dramatically different patterns of theta activity. Left panels show averaged spectrograms. Right panels show averaged power spectra for the corresponding electrodes (solid lines denote in-task power, dot–dashed lines denote out-of-task). The white bar in the _top left panel_marks the duration of the trial from the onset of the orienting cue until the presentation of the response. All three electrodes show theta activity evidenced by the peaks in the power spectra. The top panel shows an electrode with continuous, theta activity that is weakly modulated by the task. Significant task-gated theta increase in activity is evident for the electrode in the _middle panel.The bottom panels show suppression of theta activity during the trial. (Talairach coordinates from top to_bottom are −50, −14, +41; −54, −16, +29; −56, −24, +23.)
Similar articles
- Theta oscillations in human cortex during a working-memory task: evidence for local generators.
Raghavachari S, Lisman JE, Tully M, Madsen JR, Bromfield EB, Kahana MJ. Raghavachari S, et al. J Neurophysiol. 2006 Mar;95(3):1630-8. doi: 10.1152/jn.00409.2005. Epub 2005 Oct 5. J Neurophysiol. 2006. PMID: 16207788 Clinical Trial. - The interplay between theta and alpha oscillations in the human electroencephalogram reflects the transfer of information between memory systems.
Sauseng P, Klimesch W, Gruber W, Doppelmayr M, Stadler W, Schabus M. Sauseng P, et al. Neurosci Lett. 2002 May 17;324(2):121-4. doi: 10.1016/s0304-3940(02)00225-2. Neurosci Lett. 2002. PMID: 11988342 - Phase/amplitude reset and theta-gamma interaction in the human medial temporal lobe during a continuous word recognition memory task.
Mormann F, Fell J, Axmacher N, Weber B, Lehnertz K, Elger CE, Fernández G. Mormann F, et al. Hippocampus. 2005;15(7):890-900. doi: 10.1002/hipo.20117. Hippocampus. 2005. PMID: 16114010 - Control mechanisms in working memory: a possible function of EEG theta oscillations.
Sauseng P, Griesmayr B, Freunberger R, Klimesch W. Sauseng P, et al. Neurosci Biobehav Rev. 2010 Jun;34(7):1015-22. doi: 10.1016/j.neubiorev.2009.12.006. Epub 2009 Dec 16. Neurosci Biobehav Rev. 2010. PMID: 20006645 Review. - Maintenance of multiple working memory items by temporal segmentation.
Jensen O. Jensen O. Neuroscience. 2006 Apr 28;139(1):237-49. doi: 10.1016/j.neuroscience.2005.06.004. Epub 2005 Dec 5. Neuroscience. 2006. PMID: 16337089 Review.
Cited by
- The Importance of Cursive Handwriting Over Typewriting for Learning in the Classroom: A High-Density EEG Study of 12-Year-Old Children and Young Adults.
Ose Askvik E, van der Weel FRR, van der Meer ALH. Ose Askvik E, et al. Front Psychol. 2020 Jul 28;11:1810. doi: 10.3389/fpsyg.2020.01810. eCollection 2020. Front Psychol. 2020. PMID: 32849069 Free PMC article. - Cholinergic basal forebrain neurons burst with theta during waking and paradoxical sleep.
Lee MG, Hassani OK, Alonso A, Jones BE. Lee MG, et al. J Neurosci. 2005 Apr 27;25(17):4365-9. doi: 10.1523/JNEUROSCI.0178-05.2005. J Neurosci. 2005. PMID: 15858062 Free PMC article. - Biphasic Cholinergic Modulation of Reverberatory Activity in Neuronal Networks.
Li XW, Ren Y, Shi DQ, Qi L, Xu F, Xiao Y, Lau PM, Bi GQ. Li XW, et al. Neurosci Bull. 2023 May;39(5):731-744. doi: 10.1007/s12264-022-01012-7. Epub 2023 Jan 21. Neurosci Bull. 2023. PMID: 36670292 Free PMC article. - Does data cleaning improve brain state classification?
Meisler SL, Kahana MJ, Ezzyat Y. Meisler SL, et al. J Neurosci Methods. 2019 Dec 1;328:108421. doi: 10.1016/j.jneumeth.2019.108421. Epub 2019 Sep 18. J Neurosci Methods. 2019. PMID: 31541912 Free PMC article. - Oscillatory multiplexing of population codes for selective communication in the mammalian brain.
Akam T, Kullmann DM. Akam T, et al. Nat Rev Neurosci. 2014 Feb;15(2):111-22. doi: 10.1038/nrn3668. Epub 2014 Jan 17. Nat Rev Neurosci. 2014. PMID: 24434912 Free PMC article. Review.
References
- Baddeley AD. Working memory. Clarendon; Oxford, UK: 1986.
- Bland BH. The physiology and pharmacology of hippocampal formation theta rhythms. Prog Neurobiol. 1986;26:1–54. - PubMed
- Caplan JB, Kahana MJ, Sekuler R, Kirschen M, Madsen JR (2000) Task dependence of human theta: the case for multiple cognitive functions, in press.
- Fernandez G, Effern A, Grunwald T, Pezer N, Lehnertz K, Dumpelmann M, Van Roost D, Elger CE. Real-time tracking of memory formation in the human rhinal cortex and hippocampus. Science. 1999;285:1582–1585. - PubMed
Publication types
MeSH terms
LinkOut - more resources
Full Text Sources
Other Literature Sources


