Differential expression of the small-conductance, calcium-activated potassium channel SK3 is critical for pacemaker control in dopaminergic midbrain neurons - PubMed (original) (raw)
Differential expression of the small-conductance, calcium-activated potassium channel SK3 is critical for pacemaker control in dopaminergic midbrain neurons
J Wolfart et al. J Neurosci. 2001.
Abstract
The physiological activity of dopaminergic midbrain (DA) neurons is important for movement, cognition, and reward. Altered activity of DA neurons is a key finding in schizophrenia, but the cellular mechanisms have not been identified. Recently, KCNN3, a gene that encodes a member (SK3) of the small-conductance, calcium-activated potassium (SK) channels, has been proposed as a candidate gene for schizophrenia. However, the functional role of SK3 channels in DA neurons is unclear. We combined patch-clamp recordings with single-cell RT-PCR and confocal immunohistochemistry in mouse midbrain slices to study the function of molecularly defined SK channels in DA neurons. Biophysical and pharmacological analysis, single-cell mRNA, and protein expression profiling strongly suggest that SK3 channels mediate the calcium-dependent afterhyperpolarization in DA neurons. Perforated patch recordings of DA neurons in the substantia nigra (SN) demonstrated that SK3 channels dynamically control the frequency of spontaneous firing. In addition, SK3 channel activity was essential to maintain the high precision of the intrinsic pacemaker of DA SN neurons. In contrast, in the ventral tegmental area, DA neurons displayed significantly smaller SK currents and lower SK3 protein expression. In these DA neurons, SK3 channels were not involved in pacemaker control. Accordingly, they discharged in a more irregular manner compared with DA SN neurons. Thus, our study shows that differential SK3 channel expression is a critical molecular mechanism in DA neurons to control neuronal activity. This provides a cellular framework to understand the functional consequences of altered SK3 expression, a candidate disease mechanism for schizophrenia.
Figures
Fig. 1.
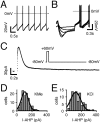
Electrophysiological profile and_I_AHPs in SN DA neurons. _A,_Whole-cell, current-clamp recording of spontaneous pacemaker activity (1.5 Hz). Note pronounced AHP after single action potentials.B, Overlay of voltage responses to hyperpolarizing current injections of increasing intensity. Note prominent “sag” component mediated by _I_h activation.C, Whole-cell, voltage-clamp recording of an_I_AHP, activated by a hybrid clamp protocol (inset). D, E, Frequency distributions of _I_AHP peak amplitudes, recorded with KMe (D) or high KCl (E) pipette solutions, were well described by single Gaussian functions with mean _I_AHPamplitudes of 105 ± 6 pA (n = 108) and 122 ± 10 pA (n = 89), respectively.
Fig. 2.
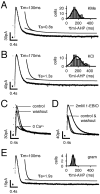
m_I_AHPs in SN DA neurons are calcium- and 1-EBIO-sensitive. A, B, Whole-cell voltage-clamp _I_AHP recordings._I_AHP decay was best described with biexponential functions with a medium (∼150 msec) and a slow (∼1 sec) time constant (τm and τs). The medium component accounted for 80% of the _I_AHP amplitude (79 ± 10%;n = 181). Frequency distributions of τm values could be fitted with single Gaussian functions (insets) with a mean τm of 135 ± 7 msec (A, KMe;n = 105) and 174 ± 11 msec (B, KCl; n = 88), respectively. Mean τs values (data not shown) were 1.1 ± 0.1 sec for both solutions (KMe,n = 93; KCl, n = 56).C, m_I_AHPs were dependent on extracellular calcium. Removal of extracellular calcium (0 Ca2+) reversibly blocked 88 ± 5% of the fitted m_I_AHP amplitude (n = 7), but had no effect on the slow_I_AHP. D, 1-EBIO, an SK channel activator, reversibly increased _I_AHPamplitudes and slowed the _I_AHP decay.E, _I_AHPs recorded with gramicidin-perforated recordings (gram) had smaller amplitudes (46 ± 4 pA; n = 8) compared with those recorded in the whole-cell mode (Fig. 1), but similar τm values (108 ± 9 msec; n = 8).
Fig. 3.
m_I_AHPs in SN DA neurons are apamin- and
d
-tubocurarine-sensitive. Whole-cell voltage-clamp recordings of SN DA neurons. A, The medium_I_AHP was completely blocked by 300 n
m
apamin (apa), whereas the slow_I_AHP component was not affected.Inset shows time course of normalized_I_AHP amplitudes during the experiment.B, The mean dose–response for apamin inhibition was well described by a single Hill function with an IC50 of 8.5 n
m
and a Hill coefficient of 0.9 (_n_= 53). C, The medium _I_AHP was also selectively blocked by 1 m
md
TC. In contrast to apamin, the inhibition by
d
TC was readily reversible (inset). Mean dose–response for
d
TC inhibition was well described by a single Hill function with an IC50 of 52 μ
m
and a Hill coefficient of 1.5 (n = 30).
Fig. 4.
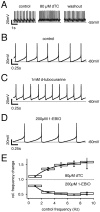
SK channels dynamically control pacemaker frequencies in DA SN neurons. A–D, Current-clamp recordings of SN DA neurons in the gramicidin-perforated patch configuration. A, Partial (2/3) inhibition of SK channels by 80 μ
md
TC resulted in a reversible increase of spontaneous discharge (3.8–4.8 Hz).B, Control pacemaker frequency (2.3 Hz). Note that single spike AHPs peak at −60 mV. C, A 1 m
m
concentration of
d
TC reduced AHP peak amplitudes and increased the spiking frequency to 3.3 Hz (relative change, 1.4).D, A 200 μ
m
concentration of 1-EBIO increased AHP peak amplitudes and duration and decreased the spiking frequency to 1.3 Hz (relative change, 0.5). Action potentials were truncated for clarity. E, Summary of experiments as in_A–D_. Control frequencies were combined in 2 sec bins (n = 3–31) to compare the effect of 200 μ
m
1-EBIO, 80 μ
md
TC. A broader frequency range (>6 Hz) was achieved by injecting positive current. Partial inhibition and activation of SK channels by 80 μ
md
TC and 200 μ
m
1-EBIO, respectively, altered the discharge rate in a frequency-dependent manner with increased efficiency at higher discharge rates.
Fig. 5.
d
-Tubocurarine-sensitive SK channels maintain high precision of the pacemaker in DA SN neurons.A–C, Current-clamp recordings of SN DA neurons in the gramicidin-perforated patch configuration during control and
d
TC application. Representative traces (10 sec) are shown for each condition. Action potentials were truncated at −30 mV, and mean peak AP amplitudes were −29.1 ± 0.1 mV (n = 50) for control, −27.7 ± 0.1 mV (n = 50) for 80 μ
md
TC, and −21.0 ± 0.6 mV (n = 50) for 1 m
md
TC. ISI histograms for each condition are depicted in the right panels, respectively. ISI frequency distributions were described by single Gaussian functions, and the resulting coefficient of variation was calculated as a measure of pacemaker precision. A, Control (CV, 6%).B, Partial (2/3) inhibition of SK channels by 80 μ
md
TC increased the spiking frequency and decreased spiking precision (CV, 9%). C, Complete block of SK channels (1 m
md
TC) resulted in a further reduction of spiking precision (CV, 16%). D, Summary of experiments as in A–C. The mean CVs in control, 80 μ
md
TC, 1 m
md
TC, and washout were 12.4 ± 1.6% (n = 12), 17.5 ± 1.8% (n = 12; p = 0.001), 30.0 ± 2.9% (n = 10; p< 0.0005), and 15.6 ± 2.4% (n = 3), respectively.
Fig. 6.
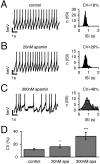
Selective inhibition of SK channels by apamin dramatically reduces pacemaker precision in DA SN neurons.A–C, Current-clamp recordings of SN DA neurons in the gramicidin-perforated patch configuration during control and apamin application. Representative traces (10 sec) are shown for each condition. Action potentials were truncated at −15 mV, and mean peak AP amplitudes were −7.8 ± 0.1 mV (n = 50) for control, −6.7 ± 0.2 mV (n = 50) for 20 n
m
apamin, and −5.8 ± 0.2 mV (_n_= 50) for 300 n
m
apamin. ISI histograms for each condition are depicted in the right panels, respectively. ISI frequency distributions were described by single Gaussian functions, and the resulting coefficient of variation was calculated as a measure of pacemaker precision. A, Control (CV, 18%).B, Partial inhibition of SK channels by 20 n
m
apamin decreased spiking precision (CV, 26%).C, Complete block of SK channels (300 n
m
apamin) resulted in a strong reduction of spiking precision (CV, 48%).D, Summary of experiments as in A–C. The mean CVs in control, 20 n
m,
and 300 n
m
apamin were 12.1 ± 1.2% (n = 11), 16.5 ± 2.3% (n = 9; p = 0.02), and 32.8 ± 5.6% (n = 11; p< 0.005), respectively.
Fig. 7.
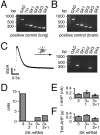
SK3 mRNA is the dominant SK mRNA species in single, identified SN DA neurons. A, B, PCR products of nested PCR reactions were resolved in separate lanes by gel electrophoresis gels in parallel with a 100 bp ladder as molecular weight marker. All SK channel subunit mRNAs as well GAD and TH mRNAs are expressed in mouse lung tissue (positive controls), and with the exception of SK4, all transcripts were also present in brain. The predicted sizes (in base pairs) of the PCR amplicons were 702 (GAD67), 377 (TH), 375 (SK1), 310 (SK2), 290 (SK3), and 285 (SK4).C, Single-cell RT-multiplex PCR experiment of a DA SN neuron: after eliciting the I_AHP current (left panel) (compare Fig. 1_C), the cytoplasm was harvested for RT-mPCR analysis. The respective single-cell mRNA expression profile (TH+, SK3+) was displayed by gel electrophoresis (right panel). D, Distribution of single-cell RT-mPCR expression profiles from SN DA (TH+) neurons with medium_I_AHPs. E, F, Single-cell phenotype–genotype correlation between amplitude (E) and kinetics (F) of_I_AHP and SK1-SK3 expression profiles in DA SN neurons. Codetection of SK1 and/or SK2 with the prominent SK3 was not correlated with a significantly different_I_AHP phenotype.
Fig. 8.
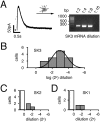
Semiquantitative single-cell RT-PCR demonstrates that SK3 mRNA is most abundant in SN DA neurons. A, Semiquantitative single-cell RT-PCR experiment of a DA SN neuron: after eliciting the I_AHP current (left panel) (compare Fig. 1_C), the cytoplasm was harvested for RT. Serial dilutions of the single-cell cDNA pool were analyzed by nested PCR. Gel electrophoresis analysis (right panel) demonstrated SK3 detection in up to one-eighth of the respective single-cell cDNA pool. B–D, Frequency distribution of SK3 (A), SK2 (B), and SK1 (C) detection thresholds in SN DA (TH+) neurons. Whereas SK1 and SK2 were not detected in most cases (white bars), the distribution of SK3 detection thresholds was well described with single Gaussian function, indicating a mean detection from 13 ± 4% (2−2.9; n = 13; B) of the single-cell cDNA pools.
Fig. 9.
Double immunolabeling indicates prominent SK3 protein expression in dopaminergic midbrain neurons. _A_shows a low-power overview of the distribution of SK3 immunoreactivity (red) in a coronal mouse midbrain section. Note prominent SK3 signals in the ventral tier of substantia nigra pars compacta (SNpc, A9), and weaker staining in the dorsal SNpc and the VTA (A10). B shows the TH immunolabeling in the same section revealing the well described distribution of TH-positive, i.e., dopaminergic, midbrain neurons in the A9 and A10 nuclei. The superimposed image shown in C indicates cellular colocalization of SK3 and TH protein within the SNpc and to a lesser degree in the VTA at higher power. Scale bars, 200 μm.
Fig. 10.
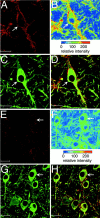
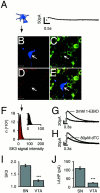
Differential SK3 protein expression in dopaminergic SN and VTA neurons. A–D, Double immunolabeling of SK3 (red, A;pseudocolor-coded SK3 intensity map, B) and TH (green, C; SK3 + TH overlay, D) of an SN neuron (arrow). Note that SK3 immunolabeling is most intense along the somatodendritic membrane of the DA SN neuron. SK3 protein is also present on TH-positive neuropil. E–H, Double immunolabeling of SK3 (red, E; pseudocolor-coded SK3 intensity map, F) and TH (green,G; SK3 + TH overlay_, H_) of VTA neurons. Scanned with identical confocal settings for direct comparison of SK3 immunosignals in SN and VTA neurons, note that SK3 immunolabeling also labels somatodendritic membranes of VTA DA neurons but is considerably weaker compared with that in SN DA neurons. Scale bars, 20 μm.
Fig. 11.
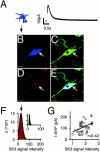
_I_AHP amplitudes correlate with the intensity of SK3 immunolabeling in single DA SN neurons. A, _I_AHP current was elicited in whole-cell recording of an SN DA neuron that was filled with 0.2% neurobiotin for identification during subsequent quantitative confocal microscopy (B–F). Triple immunolabeling of recorded SN DA neuron of neurobiotin (blue, B), TH (green, C), and SK3 (red, D; neurobiotin + TH + SK3 overlay,E). F, Semiquantitative analysis of the SK3 immunolabeling intensity distribution of the recorded SN DA neuron (arrow). A Gaussian function was fitted to the intensity distribution to determine the mean SK3 intensity level of the respective neuron (arrow; 26 ± 0.02). The SK3 background signal intensity was also well described by a Gaussian function (mean, 14 ± 0.004; inset). Scale bars, 20 μm. G, Single-cell correlations between_I_AHP current amplitudes and SK3 immunolabeling intensities (normalized to fitted SK3 noise levels) as shown in A–F. The line indicates linear regression with a correlation coefficient of r = 0.42 (n = 44; p < 0.005).
Fig. 12.
VTA DA neurons express smaller_I_AHP currents and lower SK3 immunolabeling compared with SN DA cells. A, Small_I_AHP was elicited in whole-cell recording of a VTA DA neuron that was filled with 0.2% neurobiotin for identification during subsequent quantitative confocal microscopy (B–F). Triple immunolabeling of recorded VTA DA neuron of neurobiotin (blue, B), TH (green, C), and SK3 (red,D; neurobiotin + TH + SK3 overlay, E). Scale bars, 20 μm. F, Semiquantitative analysis of the SK3 immunolabeling intensity distribution of the recorded SN DA neuron (arrow). A Gaussian function was fitted to the intensity distribution to determine the mean SK3 intensity level of the respective neuron (mean, 11 ± 0.01). The SK3 background signal intensity was also well described by a Gaussian function (mean, 9 ± 0.08; inset). G, H, Small_I_AHP currents in VTA DA neurons show similar sensitivity to 1-EBIO (1.9 ± 0.1-fold potentiation;n = 16) and
d
TC sensitivity (inhibition by 40 ± 4%; n = 9) but slower kinetics compared with those in DA SN neurons. I, Normalized SK3 immunolabeling intensities of recorded and reconstructed SN DA neurons (1.85 ± 0.05; n = 44) were 3.7-fold higher compared with those of VTA DA neurons (1.23 ± 0.04;n = 12; p < 0.0005).J, Similar to SK3 immunolabeling intensities,_I_AHP amplitudes of recorded and reconstructed SN DA neurons (111 ± 7 pA; 91 ± 7% m_I_AHPs; n = 44) were 4.0-fold larger compared with those of VTA DA neurons (25 ± 1 pA;n = 12; p < 0.0005).
Fig. 13.
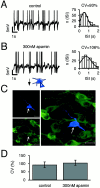
Identified VTA DA neurons display apamin-insensitive, low-precision firing compared with SN DA neurons. Current-clamp recordings of an immunohistochemically identified VTA DA neuron in the gramicidin-perforated patch configuration during control (A) and application of 300 n
m
apamin (B). Representative traces (10 sec) are shown in the left panels. Action potentials were truncated at −15 mV, and mean peak AP amplitudes were −12.3 ± 0.1 mV (n = 50) for control and −6.3 ± 0.3 mV (n = 50) for 300 n
m
apamin. ISI histograms for each condition are depicted in the right panels, respectively. ISI frequency distributions were described by single Gaussian functions, and the resulting coefficient of variation was calculated as a measure of pacemaker precision.A, VTA DA neurons showed low pacemaker precision during control condition (CV, 93%) compared with SN DA neurons (Figs. 5, 6).B, Pacemaker precision and AHPs were not significantly affected by complete inhibition of SK channels (300 n
m
apamin; CV, 106%). C, Identification and immunolabeling of the same neuron shown in A and B. After the perforated-patch recording, the recording was converted to standard whole-cell, and the cell was filled with 0.2% neurobiotin. Subsequent double immunolabeling identified (neurobiotin,blue) and confirmed the recorded cell as a dopaminergic VTA neuron (TH, green; overlay in right panel). Scale bars, 20 μm. D, Summary of experiments as in A–C. The mean CVs in control and 300 n
m
apamin were 93.8 ± 17.4% (n = 8) and 105.6 ± 16.0% (n = 8; p = 0.3).
Fig. 14.
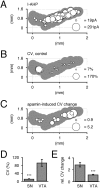
The topography of differential expression and function of SK3 channels in dopaminergic midbrain neurons.A–C, Spatial distribution of DA neurons in representative coronal midbrain slices (dorsal, up; medial, left). Each symbol represents a recorded, filled, and immunohistochemically identified DA neuron.A, _I_AHP amplitudes of VTA and SN DA neurons. Symbol sizes corresponds to_I_AHP amplitudes. VTA DA neurons display smaller _I_AHPs. B, Pacemaker precision of VTA and SN DA neurons. Symbol sizes represent CV values (Figs. 5, 6, and 13). SN DA neurons display low CV values (high pacemaker precision). C, Effect of selective SK inhibition (300 n
m
apamin) on pacemaker precision of VTA and SN DA neurons. Symbol sizes represent apamin-induced changes of CV values. Pacemaker precisions of VTA DA neurons were less affected by SK inhibition. D, E, Summary of experiments in_B_ and C. Under control conditions, the mean CV of SN DA neurons (12.4 ± 0.9%; n = 17) was significantly smaller compared with VTA DA neurons (93.8 ± 17.4%; n = 8; p < 0.0005).E, Application of 300 n
m
apamin increased CV values approximately threefold in SN DA neurons (2.9 ± 0.4;n = 10; p < 0.005) but had no significant effects on firing of VTA DA cells (1.2 ± 0.1;n = 8).
Similar articles
- Selective coupling of T-type calcium channels to SK potassium channels prevents intrinsic bursting in dopaminergic midbrain neurons.
Wolfart J, Roeper J. Wolfart J, et al. J Neurosci. 2002 May 1;22(9):3404-13. doi: 10.1523/JNEUROSCI.22-09-03404.2002. J Neurosci. 2002. PMID: 11978817 Free PMC article. - I(h) channels contribute to the different functional properties of identified dopaminergic subpopulations in the midbrain.
Neuhoff H, Neu A, Liss B, Roeper J. Neuhoff H, et al. J Neurosci. 2002 Feb 15;22(4):1290-302. doi: 10.1523/JNEUROSCI.22-04-01290.2002. J Neurosci. 2002. PMID: 11850457 Free PMC article. - Tuning the excitability of midbrain dopamine neurons by modulating the Ca2+ sensitivity of SK channels.
Ji H, Hougaard C, Herrik KF, Strøbaek D, Christophersen P, Shepard PD. Ji H, et al. Eur J Neurosci. 2009 May;29(9):1883-95. doi: 10.1111/j.1460-9568.2009.06735.x. Epub 2009 Apr 20. Eur J Neurosci. 2009. PMID: 19473240 Free PMC article. - Small conductance Ca2+-activated K+ channels as targets of CNS drug development.
Blank T, Nijholt I, Kye MJ, Spiess J. Blank T, et al. Curr Drug Targets CNS Neurol Disord. 2004 Jun;3(3):161-7. doi: 10.2174/1568007043337472. Curr Drug Targets CNS Neurol Disord. 2004. PMID: 15180477 Review. - Dopamine midbrain neurons in health and Parkinson's disease: emerging roles of voltage-gated calcium channels and ATP-sensitive potassium channels.
Dragicevic E, Schiemann J, Liss B. Dragicevic E, et al. Neuroscience. 2015 Jan 22;284:798-814. doi: 10.1016/j.neuroscience.2014.10.037. Epub 2014 Oct 30. Neuroscience. 2015. PMID: 25450964 Review.
Cited by
- Progressive parkinsonism due to mitochondrial impairment: Lessons from the MitoPark mouse model.
Beckstead MJ, Howell RD. Beckstead MJ, et al. Exp Neurol. 2021 Jul;341:113707. doi: 10.1016/j.expneurol.2021.113707. Epub 2021 Mar 20. Exp Neurol. 2021. PMID: 33753138 Free PMC article. Review. - Anhedonia requires MC4R-mediated synaptic adaptations in nucleus accumbens.
Lim BK, Huang KW, Grueter BA, Rothwell PE, Malenka RC. Lim BK, et al. Nature. 2012 Jul 11;487(7406):183-9. doi: 10.1038/nature11160. Nature. 2012. PMID: 22785313 Free PMC article. - Ca2+ release-dependent hyperpolarizations modulate the firing pattern of juvenile GABA neurons in mouse substantia nigra pars reticulata in vitro.
Yanovsky Y, Velte S, Misgeld U. Yanovsky Y, et al. J Physiol. 2006 Dec 15;577(Pt 3):879-90. doi: 10.1113/jphysiol.2006.117622. Epub 2006 Oct 19. J Physiol. 2006. PMID: 17053035 Free PMC article. - Cell type-specific gene expression of midbrain dopaminergic neurons reveals molecules involved in their vulnerability and protection.
Chung CY, Seo H, Sonntag KC, Brooks A, Lin L, Isacson O. Chung CY, et al. Hum Mol Genet. 2005 Jul 1;14(13):1709-25. doi: 10.1093/hmg/ddi178. Epub 2005 May 11. Hum Mol Genet. 2005. PMID: 15888489 Free PMC article. - An amino acid outside the pore region influences apamin sensitivity in small conductance Ca2+-activated K+ channels.
Nolting A, Ferraro T, D'hoedt D, Stocker M. Nolting A, et al. J Biol Chem. 2007 Feb 9;282(6):3478-86. doi: 10.1074/jbc.M607213200. Epub 2006 Dec 1. J Biol Chem. 2007. PMID: 17142458 Free PMC article.
References
- Akaike N. Gramicidin perforated patch recording and intracellular chloride activity in excitable cells. Prog Biophys Mol Biol. 1996;65:251–264. - PubMed
- Antonarakis SE, Blouin JL, Lasseter VK, Gehrig C, Radhakrishna U, Nestadt G, Housman DE, Kazazian HH, Kalman K, Gutman G, Fantino E, Chandy KG, Gargus JJ, Pulver AE. Lack of linkage or association between schizophrenia and the polymorphic trinucleotide repeat within the KCNN3 gene on chromosome 1q21. Am J Med Genet. 1999;88:348–351. - PubMed
- Austin CP, Holder DJ, Ma L, Mixson LA, Caskey CT. Mapping of hKCa3 to chromosome 1q21 and investigation of linkage of CAG repeat polymorphism to schizophrenia. Mol Psychiatry. 1999;4:261–266. - PubMed
- Berridge MJ. Neuronal calcium signaling. Neuron. 1998;21:13–26. - PubMed
- Blatz AL, Magleby KL. Single apamin-blocked Ca-activated K+ channels of small conductance in cultured rat skeletal muscle. Nature. 1986;323:718–720. - PubMed
Publication types
MeSH terms
Substances
LinkOut - more resources
Full Text Sources
Other Literature Sources
Molecular Biology Databases
