Characterization of the genomic Xist locus in rodents reveals conservation of overall gene structure and tandem repeats but rapid evolution of unique sequence - PubMed (original) (raw)
Comparative Study
Characterization of the genomic Xist locus in rodents reveals conservation of overall gene structure and tandem repeats but rapid evolution of unique sequence
T B Nesterova et al. Genome Res. 2001 May.
Abstract
The Xist locus plays a central role in the regulation of X chromosome inactivation in mammals, although its exact mode of action remains to be elucidated. Evolutionary studies are important in identifying conserved genomic regions and defining their possible function. Here we report cloning, sequence analysis, and detailed characterization of the Xist gene from four closely related species of common vole (field mouse), Microtus arvalis. Our analysis reveals that there is overall conservation of Xist gene structure both between different vole species and relative to mouse and human Xist/XIST. Within transcribed sequence, there is significant conservation over five short regions of unique sequence and also over Xist-specific tandem repeats. The majority of unique sequences, however, are evolving at an unexpectedly high rate. This is also evident from analysis of flanking sequences, which reveals a very high rate of rearrangement and invasion of dispersed repeats. We discuss these results in the context of Xist gene function and evolution.
Figures
Figure 1
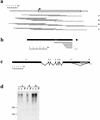
Cloning of vole Xist gene. (a) Series of λ clones isolated from genomic DNA libraries for common vole species, M. arvalis (A), M. rossiaemeridionalis (R), M. kirgisorum (K), and M. transcaspicus (T). The clone contigs have covered the whole Xist gene sequence, including extra 5′ and 3′ sequences. 5′ and 3′ boundaries of vole Xist gene were determined on the base of homology analysis with mouse. The predicted 5′ end of the gene is indicated (arrow). (b) A series of cDNA clones pulled out of M. arvalis oligo(dT) library using exon 7 and 8 probes. The size and position of clones relatively to the Xist transcript is indicated. A single clone obtained with exon 8 probe contains 0.6 kb of intron 7 sequence. Exons are shown in black with the position of introns shown in white. Exon 8 is shown distantly to the rest of the transcript to indicate the size of the intronic sequence in exon 8-contaning clone. (c) Exon-intron structure of vole Xist gene based on RT-PCR and cDNA cloning analyses. Vole Xist consists of eight exons depicted as black blocks; grey box represents long Xist transcripts found in 3′ RACE. A (n) denotes the 3′ ends of RACE products, although classical polyadenylation sites are absent in the sequence. (d) Northern blot of M. arvalis (A), M. rossiaemeridionalis (R), and M. kirgisorum (K) total RNA hybridized to exon 1 (Rx8Pst2) probe. Expression of vole somatic Xist is female-specific in all species studied.
Figure 2
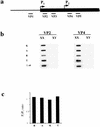
Xist transcription analysis. (a) A scheme of vole Xist, including the putative transcription start sites and the positions of the probes used in slot blot analysis. (b) Hybridization of probes to slot blots containing 10 μg of total RNA from XX and XY kidneys. No hybridization was detected for upstream VP1 probe (data not shown). The results obtained for VP2 and VP3 and for VP4 and VP5 probes were similar, hence only representative slot blots for VP2 and VP4 probes are shown. The signal was normalized to 28S RNA probe and to lambda Xist DNA for the efficiency of hybridization. (c) Quantification of slot blot data showing the usage of vole P1 and P2 start sites. Black bars represent P2/P1 ratio for M. rossiaemeridionalis (R), M.arvalis (A), M. kirgisorum (K), and M. transcaspicus (T) RNA signal. The value close to 1 suggests that all transcripts initiate upstream the VP4 and VP5 probes.
Figure 3
Mapping the vole Xist transcription start site. (a) A scheme of vole Xist, including the putative transcription start sites and the positions of the probes used in nuclease protection assay. (b) Nuclease protection assay was used to detect the position of transcription start site. Antisense riboprobes were synthesized spanning the predicted P1 and P2 start sites. 10 μg of total RNA from fibroblast cell cultures was hybridized to radiolabeled probe and digested with mung bean nuclease. Probe-, undigested probe; probe +, digested probe after hybridization to yeast RNA. Lanes R,A,T,K are for M. rossiaemeridionalis, M. arvalis, M. kirgisorum, and M. transcaspicus RNA, respectively. (P1) The band corresponding to the size of P1 start site. A sequencing ladder of known fragment is shown alongside to estimate the position of start site. The data for P1 riboprobe only is shown. (c) Sequence comparison of Xist minimal promoter between vole and mouse. Consensus initiator sequence is underlined, and the position of transcriptional start site is indicated by arrow. Conserved promoter elements I–VI are boxed (Sheardown et al. 1997b).
Figure 4
Mapping the vole Xist 3′ end. The schematic represents the Xist exons 5–8. The location of primers used for 3′ RACE is indicated with arrows. The positions of major polyadenylated 3′ ends of Xist transcripts (A, B, C, D) and probe R31 used for hybridization are shown. (a) 3′ RACE amplification of M. arvalis (A) and M. kirgisorum (T) total RNA, and M. rossiaemeridionalis (R) poly A + RNA with combination of gene-specific and universal primers, 1f +3′CDS, 2f +3′CDS, 3f +3′CDS. 1f, 2f and 3′CDS primers only were used as negative control to assure specificity of amplification. Ethidium bromide stained gel is shown for primer pair 1f +3′CDS and 1f control. Three major bands (A, B, C) are indicated with arrows. (b) Southern blot hybridization of Xist probe R31 is shown for primer pair 2f +3′CDS and controls to prove specificity of amplified fragments. Bands corresponding to the 3′ ends of Xist (B, C, D) are indicated with arrows.
Figure 5
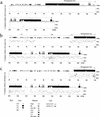
Comparative analysis of Xist gene in vole, mouse and human. (a) Percent identity plot (PIP) of M. kirgisorum Xist relative to M. arvalis Xist. M. kirgisorum genomic sequence is shown on the X axis, and the percentage of its identity (50%–100%) to M. arvalis Xist is shown on the Y axis. Black boxes illustrate Xist exons; the other sequence features and repeat elements are indicated with shape and shade coded icons (see annotation underneath Figure, panel c). (b) PIP of M. kirgisorum Xist (X axis) relative to mouse Xist (Y axis). (c) PIP of M. kirgisorum Xist (X axis) relative to human Xist (Y axis). (d) PIP of mouse Xist (X axis) relative to human Xist (Y axis); regions 1, 2, and 3 (Lee et al. 1999) are marked as R1, R2, and R3, respectively. (e) PIP of human Xist (X axis) relative to mouse Xist (Y axis); regions 1, 2, and 3 (Lee et al. 1999) are marked as R1, R2, and R3, respectively. (f) Comparison of SINE, LINE, LTR elements and total interspersed repeat representation in the Xist upstream sequence of M. arvalis (A), M. rossiaemeridionalis (R), M. transcaspicus (T), M. kirgisorum (K), M. musculus (M), and H. sapiens (H). The Y axis represents the percentage of genomic Xist upstream sequence occupied by repeat elements. (Figure continues on following page.)
Figure 6
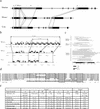
Tandem repeats in the Xist gene. (a) Schematic representation of tandem repeats in human, mouse, and vole Xist gene. Similar repeats in different species are connected by thin lines. The size and features of specific repeats are indicated in e. (b) Schematic representation of the D repeat region. Individual copies and their position are indicated. Previously published region indicated as D core. Human D-core consists of 7.7 tandem copies, and mouse and vole contain five truncated copies of various length. Truncated copies of D repeat are found in surrounding regions in all three species, thereby increasing the length of D-repeat region. (c) Length and position of D repeat copies found in extended D region. The homology to previously published consensus is color coded. (d) alignment of F repeat region between M. kirgisorum (K), M. arvalis (A), M. rossiaemeridionalis (R), M. transcaspicus (T), mouse (M), and human (H). Consensus sequence containing a putative binding site is boxed. Positions of identical nucleotides in all six species are marked with asterisks. (e) Monomer size and copy number of tandem repeats in the Xist gene. 1M1 +M2 – motifs 1 and 2; numbers in brackets represent the monomer copy number in each species.
Similar articles
- A regulatory potential of the Xist gene promoter in vole M. rossiaemeridionalis.
Orishchenko KE, Pavlova SV, Elisaphenko EA, Sherstyuk VV, Prinz AV, Shevchenko AI, Dementyeva EV, Zakian SM. Orishchenko KE, et al. PLoS One. 2012;7(5):e33994. doi: 10.1371/journal.pone.0033994. Epub 2012 May 11. PLoS One. 2012. PMID: 22606223 Free PMC article. - Comparative mapping of X chromosomes in vole species of the genus Microtus.
Nesterova TB, Duthie SM, Mazurok NA, Isaenko AA, Rubtsova NV, Zakian SM, Brockdorff N. Nesterova TB, et al. Chromosome Res. 1998 Jan;6(1):41-8. doi: 10.1023/a:1009266324602. Chromosome Res. 1998. PMID: 9510509 - A revision of the human XIST gene organization and structural comparison with mouse Xist.
Hong YK, Ontiveros SD, Strauss WM. Hong YK, et al. Mamm Genome. 2000 Mar;11(3):220-4. doi: 10.1007/s003350010040. Mamm Genome. 2000. PMID: 10723727 - Xist regulation and function explored.
Pontier DB, Gribnau J. Pontier DB, et al. Hum Genet. 2011 Aug;130(2):223-36. doi: 10.1007/s00439-011-1008-7. Epub 2011 May 28. Hum Genet. 2011. PMID: 21626138 Free PMC article. Review. - Xist and X chromosome inactivation.
Kay GF. Kay GF. Mol Cell Endocrinol. 1998 May 25;140(1-2):71-6. doi: 10.1016/s0303-7207(98)00032-x. Mol Cell Endocrinol. 1998. PMID: 9722171 Review.
Cited by
- Derivation of a minimal functional XIST by combining human and mouse interaction domains.
Navarro-Cobos MJ, Morales-Guzman SI, Baldry SEL, Brown CJ. Navarro-Cobos MJ, et al. Hum Mol Genet. 2023 Apr 6;32(8):1289-1300. doi: 10.1093/hmg/ddac285. Hum Mol Genet. 2023. PMID: 36426827 Free PMC article. - The region homologous to the X-chromosome inactivation centre has been disrupted in marsupial and monotreme mammals.
Hore TA, Koina E, Wakefield MJ, Marshall Graves JA. Hore TA, et al. Chromosome Res. 2007;15(2):147-61. doi: 10.1007/s10577-007-1119-0. Epub 2007 Mar 5. Chromosome Res. 2007. PMID: 17333539 - The role of Xist-mediated Polycomb recruitment in the initiation of X-chromosome inactivation.
Bousard A, Raposo AC, Żylicz JJ, Picard C, Pires VB, Qi Y, Gil C, Syx L, Chang HY, Heard E, da Rocha ST. Bousard A, et al. EMBO Rep. 2019 Oct 4;20(10):e48019. doi: 10.15252/embr.201948019. Epub 2019 Aug 27. EMBO Rep. 2019. PMID: 31456285 Free PMC article. - The tandem repeat modules of Xist lncRNA: a swiss army knife for the control of X-chromosome inactivation.
Raposo AC, Casanova M, Gendrel AV, da Rocha ST. Raposo AC, et al. Biochem Soc Trans. 2021 Dec 17;49(6):2549-2560. doi: 10.1042/BST20210253. Biochem Soc Trans. 2021. PMID: 34882219 Free PMC article. Review. - Perspectives on the mechanism of transcriptional regulation by long non-coding RNAs.
Roberts TC, Morris KV, Weinberg MS. Roberts TC, et al. Epigenetics. 2014 Jan;9(1):13-20. doi: 10.4161/epi.26700. Epub 2013 Oct 22. Epigenetics. 2014. PMID: 24149621 Free PMC article. Review.
References
- Altschul SF, Gish W, Miller W, Myers EW, Lipman DJ. Basic local alignment search tool. J Mol Biol. 1990;215:403–410. - PubMed
- Bird AP. CpG rich islands and the function of DNA methylation. Nature. 1986;321:209–213. - PubMed
- Borsani G, Tonlorenzi R, Simmler MC, Dandolo L, Arnaud D, Capra V, Grompe M, Pizzuti A, Muzny D, Lawrence C, et al. Characterization of a murine gene expressed from the inactive X chromosome. Nature. 1991;351:325–329. - PubMed
Publication types
MeSH terms
Substances
LinkOut - more resources
Full Text Sources
Other Literature Sources
Medical


