Sensorimotor mapping of the human cerebellum: fMRI evidence of somatotopic organization - PubMed (original) (raw)
Sensorimotor mapping of the human cerebellum: fMRI evidence of somatotopic organization
W Grodd et al. Hum Brain Mapp. 2001 Jun.
Abstract
Functional magnetic resonance imaging (fMRI) was employed to determine areas of activation in the cerebellar cortex in 46 human subjects during a series of motor tasks. To reduce the variance due to differences in individual anatomy, a specific transformational procedure for the cerebellum was introduced. The activation areas for movements of lips, tongue, hands, and feet were determined and found to be sharply confined to lobules and sublobules and their sagittal zones in the rostral and caudal spino-cerebellar cortex. There was a clear symmetry mirroring at the midline. The activation mapped as two distinct homunculoid representations. One, a more extended representation, was located upside down in the superior cerebellum, and a second one, doubled and smaller, in the inferior cerebellum. The two representations were remarkably similar to those proposed by Snider and Eldred [1951] five decades ago. In the upper representation, an intralimb somatotopy for the right elbow, wrist, and fingers was revealed. The maps seem to confirm earlier electrophysiological findings of sagittal zones in animals. They differ, however, from micromapping reports on fractured somatotopic maps in the cerebellar cortex of mammals. We assume that the representations that we observed are not solely the result of spatial integration of hemodynamic events underlying the fMRI method and may reflect integration of afferent peripheral and central information in the cerebellar cortex.
Copyright 2001 Wiley-Liss, Inc.
Figures
Figure 1
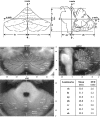
Linear transformation of the cerebellum. Upper row: Three perpendicular planes (midsagittal x‐plane, y‐plane along the floor of the fourth ventricle, z‐plane through the apex of the fourth ventricle) centered at the dorsal pons with definition of seven anatomical landmarks (rh = right hemisphere; lh = left hemisphere; rv = rostral vermis; cv = caudal vermis; ch = caudal hemisphere; dh = dorsal hemisphere; ap = anterior pons) used for transformation. Mean values (n = 20) for determined landmarks are given in lower right table. Middle row and lower left: Cerebellar template after linear transformation and averaging with examples of coronal, sagittal, and axial sections, scaled in mm. Long white lines: position of the corresponding slices. Assignments: Roman numbers = lobules; a, b, c, d, e, f = lamellae, according to Larsell and Jansen [1971]; f.h. = fissura horizontalis; f.p. = fissura prima; f.pp. = fissura praepyramidalis; f.s.p. = fissura superior posterior.
Figure 2
Individual activation maps of 10 subjects during repetitive movement of the right hand (red), left hand (green), and lips (blue) (P < 0.05) in coronal and axial projections. The axes scaled in mm. The color intensity scales the correlation coefficient from threshold to maximum. The individual correlation maxima are given in the upper left of the axial projections for the right hand, left hand, and lips. Assignments: R = right; L = left.
Figure 3
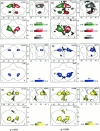
Group activation maps during movements of the arm (right hand = red; left hand = green, upper row) and face (lips = blue, middle row; tongue = yellow, lower row) at two different correlation levels (right column P < 0.01, left column P < 0.05) in sagittal, coronal, and axial projections. The color intensity scales the correlation coefficient from threshold to the maximum. The axes are scaled in mm. Assignments: R = right; L = left.
Figure 4
Group activation displayed on individual cerebellar template for movements of the hands (right = red; left = green), the lips (blue), and the feet (cyan) (P < 0.01). (a) left parasagittal, (b) coronal, (c) right parasagittal, (d) inferior axial, (e) medio axial, and (f) superior axial sections. Assignments: R = right; L = left; f.h. = fissura horizontalis; f.p.= fissura prima; f.sec. = fissura secunda; f.s.p.= fissura superior posterior. The outline of the activation is mainly confined to the cerebellar cortex, and the course of the foliae and larger fissures (a, b, c). Note the poor overlap of right and left arm (b), and of the adjacent arm and lip areas (a, c, e). The primary fissure separates the arm area in lobulus HVb from the lip area in HVI (e). In the upper cerebellum, two separate arm areas are found, one vermal in Va (b, e) and a second HVb in the intermediate hemisphere (a, c, e). The intermediate arms and lips areas do not reach the lateral zone of the hemisphere, and spare the medial aspect of the intermediate hemisphere (e). Only the rostral border of the arm reaches the fissura intraculminaris II, thus sparing HVa (a, c, f). Note also, that, while the activation in the upper cerebellum reaches cerebellar surface, the activation in the lower cerebellum is restricted to the depth of the fissures (a, c, d). There is only little ipsilateral activation during right (c) and left (f) foot movement in HIV. Neither within the white matter, nor in the cerebellar nuclei, was no activation found.
Figure 5
Intralimb movements of the right arm. Coronal and axial maximum‐intensity‐projections of the correlation coefficients. The axes are scaled in mm. R = right. Group results (P < 0.01) of movements of the right elbow (brown), wrist (yellow), thumb (green), index (cyan), ring (blue), and little finger (violet). Note that both the wrist and the thumb have local maxima in the vermis and the hemisphere, which are connected by a thin band—at a lower degree of correlation—similar to the pattern of the hand (Fig. 4).
Figure 6
Intralimb topography. (a) Right hemicerebellum with hand clusters from Figure 3a. (b) The biggest clusters of the elbow, wrist, and fingers, color‐coded, outlined, and superimposed on the gray‐scaled hand area. Hand, wrist, and thumb movement exhibit activations in nearly the same areas in V and HV. Wrist and thumb movements are further correlated with activations in HVIII. Both areas are localized within the hand area. Movement in the elbow yields activations in the vermal zone of the hand area only. (c) Blowup defined by the inserts in (a). The highest activated 10 mm3 of the elbow, wrist, and fingers are shown, superimposed on the hand area again. The fingers are aligned along the dorsal border of the hand area in HVd, near the primary fissure. The wrist maximum is located more ventrally.
Figure 7
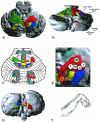
Functional somatotopy of the cerebellum. Display of a single cerebellar surface with superimposed color‐coded fMRI activation volumes with oblique cranio‐caudal (a) and dorsal view (b) of the cerebellar surface. (c) Display of the cerebellar homunculi as represented by Snider and Eldred (1951). (d) Blowup of the right hand area from (a) with superimposed activation maxima for elbow, wrist, and finger movement. (e) Oblique caudo‐cranial view on the cerebellar surface. (f) Schematic impression of right arm finger positions shown in (d). Assignments: E = right elbow; W = right wrist; I, II, III, V = fingers I, II, III, V. Colors: blue = feet; green = left hand; red = right hand; yellow = tongue; dark blue = lips; light brown = elbow; gray‐green = wrist; white circles = fingers.
Figure 8
Maps of cerebellar functions from different studies superimposed on a cerebellar matrix scheme of an unfolded hemicerebellum with the midsagittal border on the left side, cranial parts on the top. The rows are labeled according to Larsell and Jansen [1971] and the columns are labeled according to Voogd and Glickstein [1998]. Larger fissures are labeled. Foliae, which are buried in the depth of the fissures, are shaded gray. The colors indicate different body parts as defined on the bottom. (a) Results of Snider and Eldred [1951] of spino‐ and cerebro‐ponto‐cerebellar projections as found in the monkey and hypothesized for man. (b) Results of Oscarsson [1976, Fig. 1] and Ekerot et al. [1991, Fig. 5] of spino‐olivo‐cerebellar projections in rat and cat. (c) Results of Kassel et al. [1984, Fig. 6] and Welker [1987, Fig. 5, 6] of spinocerebellar projections in oppossum, rat, and cat. (d) Results of Middelton and Strick [1997, Fig. 4] of cerebro‐ponto‐cerebellar projections in monkey. (e) Present results of presumably spino‐, spino‐olivo‐ and cerebro‐ponto‐cerebellar projections in man.
Similar articles
- Somatotopic motor representation in the human anterior cerebellum. A high-resolution functional MRI study.
Nitschke MF, Kleinschmidt A, Wessel K, Frahm J. Nitschke MF, et al. Brain. 1996 Jun;119 ( Pt 3):1023-9. doi: 10.1093/brain/119.3.1023. Brain. 1996. PMID: 8673479 - Activation of cerebellar nuclei comparing finger, foot and tongue movements as revealed by fMRI.
Dimitrova A, de Greiff A, Schoch B, Gerwig M, Frings M, Gizewski ER, Timmann D. Dimitrova A, et al. Brain Res Bull. 2006 Dec 11;71(1-3):233-41. doi: 10.1016/j.brainresbull.2006.09.015. Epub 2006 Oct 10. Brain Res Bull. 2006. PMID: 17113951 - Somatotopy in the ipsilateral primary motor cortex.
Alkadhi H, Crelier GR, Boendermaker SH, Hepp-Reymond MC, Kollias SS. Alkadhi H, et al. Neuroreport. 2002 Nov 15;13(16):2065-70. doi: 10.1097/00001756-200211150-00015. Neuroreport. 2002. PMID: 12438927 - Whole-body somatotopic maps in the cerebellum revealed with 7T fMRI.
Boillat Y, Bazin PL, van der Zwaag W. Boillat Y, et al. Neuroimage. 2020 May 1;211:116624. doi: 10.1016/j.neuroimage.2020.116624. Epub 2020 Feb 11. Neuroimage. 2020. PMID: 32058002 - Dexterous movement complexity and cerebellar activation: a meta-analysis.
Chan RC, Huang J, Di X. Chan RC, et al. Brain Res Rev. 2009 Mar;59(2):316-23. doi: 10.1016/j.brainresrev.2008.09.003. Epub 2008 Oct 17. Brain Res Rev. 2009. PMID: 18973773 Review.
Cited by
- Cytoarchitectonic mapping of the human brain cerebellar nuclei in stereotaxic space and delineation of their co-activation patterns.
Tellmann S, Bludau S, Eickhoff S, Mohlberg H, Minnerop M, Amunts K. Tellmann S, et al. Front Neuroanat. 2015 May 13;9:54. doi: 10.3389/fnana.2015.00054. eCollection 2015. Front Neuroanat. 2015. PMID: 26029057 Free PMC article. - Crossed cerebro-cerebellar language dominance.
Jansen A, Flöel A, Van Randenborgh J, Konrad C, Rotte M, Förster AF, Deppe M, Knecht S. Jansen A, et al. Hum Brain Mapp. 2005 Mar;24(3):165-72. doi: 10.1002/hbm.20077. Hum Brain Mapp. 2005. PMID: 15486988 Free PMC article. - Functional Connectivity between the Cerebellum and Somatosensory Areas Implements the Attenuation of Self-Generated Touch.
Kilteni K, Ehrsson HH. Kilteni K, et al. J Neurosci. 2020 Jan 22;40(4):894-906. doi: 10.1523/JNEUROSCI.1732-19.2019. Epub 2019 Dec 6. J Neurosci. 2020. PMID: 31811029 Free PMC article. - A dual larynx motor networks hypothesis.
Belyk M, Eichert N, McGettigan C. Belyk M, et al. Philos Trans R Soc Lond B Biol Sci. 2021 Dec 20;376(1840):20200392. doi: 10.1098/rstb.2020.0392. Epub 2021 Nov 1. Philos Trans R Soc Lond B Biol Sci. 2021. PMID: 34719252 Free PMC article. Review. - Surface-Based Probabilistic Fiber Tracking in Superficial White Matter.
Nie X, Ruan J, Otaduy MCG, Grinberg LT, Ringman J, Shi Y. Nie X, et al. IEEE Trans Med Imaging. 2024 Mar;43(3):1113-1124. doi: 10.1109/TMI.2023.3329451. Epub 2024 Mar 5. IEEE Trans Med Imaging. 2024. PMID: 37917515 Free PMC article.
References
- Allen G, Buxton RB, Wong EC, Courchesne E (1997): Attentional activation of the cerebellum independent of motor involvement. Science 275: 1940–1942. - PubMed
- Bandettini PA, Jesmanowicz A, Wong EC, Hyde JS (1993): Processing strategies for time‐course data sets in functional MRI of the human brain. Magn Reson Med 30: 161–173. - PubMed
- Bower JM, Woolston DC (1983): Congruence of spatial organization of tactile projections to granule cell and Purkinje cell layers of the cerebellar hemispheres of the albino rat: vertical organization of cerebellar cortex. J Neurophysiol 49: 745–766. - PubMed
- Bower JM (1997): Is the cerebellum sensory for motor's sake, or motor for sensory's sake: the view from the whiskers of a rat? Prog Brain Res 114: 463–96. - PubMed
- Braitenberg V, Atwood RP (1958): Morphological observations on the cerebellar cor‐tex. J Comp Neurol 109: 1–27. - PubMed
Publication types
MeSH terms
LinkOut - more resources
Full Text Sources


