STAT1 from the cell membrane to the DNA - PubMed (original) (raw)
STAT1 from the cell membrane to the DNA
B F Lillemeier et al. EMBO J. 2001.
Abstract
The binding of interferons (IFNs) to their receptors leads to the phosphorylation and activation of signal transducers and activators of transcription (STATs), and their translocation from the cytoplasm to the nucleus. The mechanisms by which the STATs move to the nuclear pore are not, however, known. Here it is shown that IFN-alpha and -gamma signalling and STAT1 translocation are independent of the actin cytoskeleton or microtubules. Using fluorescence loss in photobleaching (FLIP) and fluorescence recovery after photobleaching (FRAP) experiments, the mobility of a fusion protein of STAT1 with green fluorescent protein (STAT1-GFP) was compared with that of GFP and protein kinase C-GFP. In IFN-gamma-treated and control cells, cytoplasmic STAT1-GFP shows high, energy-independent, mobility comparable to that of freely diffusible GFP. A random walk model for movement of STAT1 from the plasma membrane to the nuclear pore is, therefore, indicated. Nuclear STAT1-GFP showed similar high mobility, with exclusion from nucleoli, consistent with high rates of association and dissociation of STAT1-DNA and/or STAT1-protein complexes in the nucleoplasm of the cell.
Figures
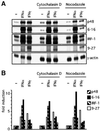
Fig. 1. Interferon signalling is not dependent on an intact cytoskeleton. (A) 2fTGH cells were incubated for 90 min with cytochalasin D or nocodazole, as indicated, then treated with 103 IU/ml IFN-α or -γ for 15 h under continued drug treatment. Expression of inducible mRNAs (p48, 6-16, IRF-1, 9-27) was monitored by RNase protection (Materials and methods). (B) Quantitation of the data in (A) by PhosphorImager analysis. Fold induction was calculated after correction for the γ-actin loading control.
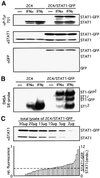
Fig. 2. STAT1–GFP is a functional transcription factor. (A and B) 2C4 (left lanes) and 2C4/STAT1–GFP cells (right lanes) were stimulated with 103 IU/ml IFN-α or -γ for 20 min. (A) Phosphorylation of STAT1–GFP. Western blot analysis of total cell lysates with an anti-P-Tyr701 specific antibody (upper panel), an anti-STAT1 antibody as loading control (middle panel) and an anti–GFP antibody to monitor for any STAT1–GFP cleavage (lower panel). No evidence for free GFP was obtained even on prolonged exposure (data not shown). (B) DNA binding of STAT1–GFP was analysed by EMSA of whole-cell extracts with an SIE probe. (C) The expression of STAT1 and STAT1–GFP in the 2C4/STAT1–GFP population was compared by analysing a series of dilutions of a total cell lysate by western blot analysis with antibody to STAT1 (upper panel). The relative fluorescence intensity of 54 single cells was analysed by confocal microscopy (left ordinate, lower panel; Materials and methods). The ratio of STAT1–GFP to endogenous STAT1 (right ordinate, lower panel) was calculated from the two data sets. The dotted line shows both the average fluorescence (left scale) and the average expression relative to STAT1 (right scale) of STAT1–GFP in the population.
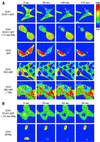
Fig. 3. FLIP analysis. (A) Cytoplasmic and (B) nuclear fluorescence. (A) 2C4 cells stably transfected with STAT1–GFP without (row 1) and after 15 min of IFN-γ treatment (103 IU/ml; row 2), GFP (row 3) and PKC–GFP without (row 4) and after 5 min of TPA treatment (Materials and methods; row 5). Every image in a row contains the same cells. The bleach region in the cytoplasm is indicated with a white square and fluorescence intensity is shown in false colour code (vertical bar, top right). Each row shows the fluorescence prior to bleaching (0 s) and after three consecutive 90 s bleach periods (90, 180 and 270 s). In the case of PKC–GFP, after TPA the plane of focus was the membrane parallel to the coverslip (row 5). (B) 2C4 cells stably transfected with STAT1–GFP and treated with IFN-γ at 103 IU/ml for 25 min (row 1) and GFPnls (row 2). Each row shows the fluorescence prior to bleaching and after three consecutive 30 s bleach periods (0, 30, 60 and 90 s, respectively) of the nuclear area bounded by the white square.
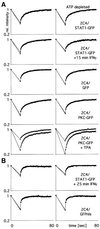
Fig. 4. FRAP analysis. (A) Cytoplasmic and (B) nuclear fluoresence. (A) 2C4 cells stably transfected with STAT1–GFP without (row 1) and after 15 min of IFN-γ treatment at 103 IU/ml (row 2), GFP (row 3) and PKC–GFP without (row 4) and after 5 min of TPA treatment (Materials and methods, row 5). Cells were bleached (Materials and methods) for 17.5 s in an area comparable to the bleach area in the FLIP analysis (white squares, Figure 3). The recovery of fluorescence in the bleach area (squares) and four surrounding areas (triangles) of the same size (averaged) was quantified over a period of further 60 s in 1 s intervals. The fluorescence was normalized to the remaining fluorescence in the cell at the end of the experiment. The right-hand panels show data for cells incubated for 20 min with sodium azide and 2-deoxyglucose to deplete ATP, prior to bleaching. Each graph represents the average of data from 10 single cells. (B) FRAP analysis of the nuclear fluorescence of 2C4 cells stably transfected with STAT1–GFP and treated with 103 IU/ml IFNγ for 25 min (row 1) and GFPnls (row 2). Bleaching, recovery, ATP deprivation (right hand panels) and symbols are as in (A). The apparently more extensive initial bleach level for membrane-associated PKC–GFP (row 5, squares) compared with that in all other rows reflects the slower movement of the membrane-associated PKC–GFP than the freely diffusing GFP and other GFP constructs during the switch of the laser from the bleach to the record modes.
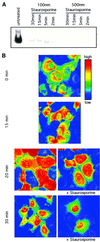
Fig. 5. Nuclear translocation of STAT1–GFP is not dependent on active JAK–receptor complexes. (A) Inhibition of JAK-dependent STAT1 activation by staurosporine. 2C4 cells were pre-treated with 100 or 500 nM staurosporine for 2, 5, 15 and 30 min, and stimulated with IFN-γ at 103 IU/ml for a further 20 min in the continued presence of the drug. Activation of STAT1 was monitored by EMSA of whole-cell extracts with an SIE probe in comparison with extracts from cells without drug treatment. [Similar results were obtained when the phosphorylation of STAT1 was monitored directly by (less sensitive) western blot analysis.] (B) Nuclear translocation of pre-activated STAT1. 2C4/STAT1–GFP cells were incubated with 103 IU/ml IFN-γ for 15 min to activate the STAT1–GFP. Staurosporine (500 nM) was added to half of the cells and both the staurosporine-treated and non-staurosporine-treated cells incubated for a further 5 and 15 min (to yield the 20 and 30 min time points, respectively). At 0, 15, 20 and 30 min, samples were fixed in paraformaldehyde and the distribution of STAT1–GFP analysed by confocal imaging. Fluorescence intensities are shown in false colour code (vertical bar, top right).
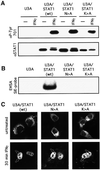
Fig. 6. Exclusion of STAT1 and STAT1 DNA-binding mutants from nucleoli. STAT1-negative U3A cells stably transfected with STAT1, STAT1-N460A or STAT1-K336A were stimulated for 20 (A and B) or 30 (C) min with 103 IU/ml IFN-γ. (A) STAT phosphorylation/activation. Proteins were immunoprecipitated with anti-STAT1 antibody and western blots performed with anti-STAT1-P-Tyr701-specific antibody (upper panel) and anti-STAT1 antibody (lower panel). (B) STAT DNA binding. EMSAs of whole-cell extracts with an SIE probe. (C) Nuclear translocation. Cells were fixed and stained with antibody to STAT1 (Materials and methods). Arrows indicate the nucleoli.
Similar articles
- Green fluorescent protein-tagging reduces the nucleocytoplasmic shuttling specifically of unphosphorylated STAT1.
Meyer T, Begitt A, Vinkemeier U. Meyer T, et al. FEBS J. 2007 Feb;274(3):815-26. doi: 10.1111/j.1742-4658.2006.05626.x. FEBS J. 2007. PMID: 17288561 - Interferon-gamma inhibits interferon-alpha signalling in hepatic cells: evidence for the involvement of STAT1 induction and hyperexpression of STAT1 in chronic hepatitis C.
Radaeva S, Jaruga B, Kim WH, Heller T, Liang TJ, Gao B. Radaeva S, et al. Biochem J. 2004 Apr 1;379(Pt 1):199-208. doi: 10.1042/BJ20031495. Biochem J. 2004. PMID: 14690454 Free PMC article. - Inhibition of the gamma interferon response by a Sendai virus C protein mutant with no STAT1-binding ability.
Gotoh B, Takeuchi K, Komatsu T. Gotoh B, et al. FEBS Lett. 2004 Jun 4;567(2-3):291-6. doi: 10.1016/j.febslet.2004.05.001. FEBS Lett. 2004. PMID: 15178339 - [Signal dependent nuclear localization of regulatory transcription factors].
Fujita T. Fujita T. Tanpakushitsu Kakusan Koso. 1999 Sep;44(12 Suppl):1914-9. Tanpakushitsu Kakusan Koso. 1999. PMID: 10503031 Review. Japanese. No abstract available. - STATs find that hanging together can be stimulating.
Leung S, Li X, Stark GR. Leung S, et al. Science. 1996 Aug 9;273(5276):750-1. doi: 10.1126/science.273.5276.750. Science. 1996. PMID: 8701326 Review. No abstract available.
Cited by
- Constitutive activation of the EGFR-STAT1 axis increases proliferation of meningioma tumor cells.
Ferluga S, Baiz D, Hilton DA, Adams CL, Ercolano E, Dunn J, Bassiri K, Kurian KM, Hanemann CO. Ferluga S, et al. Neurooncol Adv. 2020 Jan 21;2(1):vdaa008. doi: 10.1093/noajnl/vdaa008. eCollection 2020 Jan-Dec. Neurooncol Adv. 2020. PMID: 32642677 Free PMC article. - A completely foreign receptor can mediate an interferon-gamma-like response.
Strobl B, Arulampalam V, Is'harc H, Newman SJ, Schlaak JF, Watling D, Costa-Pereira AP, Schaper F, Behrmann I, Sheehan KC, Schreiber RD, Horn F, Heinrich PC, Kerr IM. Strobl B, et al. EMBO J. 2001 Oct 1;20(19):5431-42. doi: 10.1093/emboj/20.19.5431. EMBO J. 2001. PMID: 11574475 Free PMC article. - Heparanome-Mediated Rescue of Oligodendrocyte Progenitor Quiescence following Inflammatory Demyelination.
Saraswat D, Welliver RR, Ravichandar R, Tripathi A, Polanco JJ, Broome J, Hurley E, Dutta R, Feltri ML, Sim FJ. Saraswat D, et al. J Neurosci. 2021 Mar 10;41(10):2245-2263. doi: 10.1523/JNEUROSCI.0580-20.2021. Epub 2021 Jan 20. J Neurosci. 2021. PMID: 33472827 Free PMC article. - Revealing the cellular localization of STAT1 during the cell cycle by super-resolution imaging.
Gao J, Wang F, Liu Y, Cai M, Xu H, Jiang J, Wang H. Gao J, et al. Sci Rep. 2015 Mar 12;5:9045. doi: 10.1038/srep09045. Sci Rep. 2015. PMID: 25762114 Free PMC article. - STATs get their move on.
Reich NC. Reich NC. JAKSTAT. 2013 Oct 1;2(4):e27080. doi: 10.4161/jkst.27080. Epub 2013 Nov 13. JAKSTAT. 2013. PMID: 24470978 Free PMC article. Review.
References
- Akira S. et al. (1994) Molecular cloning of APRF, a novel IFN-stimulated gene factor 3 p91-related transcription factor involved in the gp130-mediated signaling pathway. Cell, 77, 63–71. - PubMed
- Allen G., Fantes,K.H., Burke,D.C. and Morser,J. (1982) Analysis and purification of human lymphoblastoid (Namalwa) interferon using a monoclonal antibody. J. Gen. Virol., 63, 207–212. - PubMed
- Cole N.B., Smith,C.L., Sciaky,N., Terasaki,M., Edidin,M. and Lippincott-Schwartz,J. (1996) Diffusional mobility of Golgi proteins in membranes of living cells. Science, 273, 797–801. - PubMed
- Darnell J.E.,Jr, Kerr,I.M. and Stark,G.R. (1994) Jak-STAT pathways and transcriptional activation in response to IFNs and other extracellular signaling proteins. Science, 264, 1415–1421. - PubMed
- Duhe R.J. and Farrar,W.L. (1998) Structural and mechanistic aspects of Janus kinases: how the two-faced god wields a double-edged sword. J. Interferon Cytokine Res., 18, 1–15. - PubMed
Publication types
MeSH terms
Substances
LinkOut - more resources
Full Text Sources
Other Literature Sources
Research Materials
Miscellaneous
