Synapse-glia interactions at the mammalian neuromuscular junction - PubMed (original) (raw)
Synapse-glia interactions at the mammalian neuromuscular junction
D Rochon et al. J Neurosci. 2001.
Abstract
Perisynaptic Schwann cells (PSCs) play critical roles in regulating and stabilizing nerve terminals at the mammalian neuromuscular junction (NMJ). However, although these functions are likely regulated by the synaptic properties, the interactions of PSCs with the synaptic elements are not known. Therefore, our goal was to study the interactions between mammalian PSCs in situ and the presynaptic terminals using changes in intracellular Ca(2+) as an indicator of cell activity. Motor nerve stimulation induced an increase in intracellular Ca(2+) in PSCs, and this increase was greatly reduced when transmitter release was blocked. Furthermore, local application of acetylcholine induced Ca(2+) responses that were blocked by the muscarinic antagonist atropine and mimicked by the muscarinic agonist muscarine. The nicotinic antagonist alpha-bungarotoxin had no effect on Ca(2+) responses induced by acetylcholine. Local application of the cotransmitter ATP induced Ca(2+) responses that were unaffected by the P2 antagonist suramin, whereas local application of adenosine induced Ca(2+) responses that were greatly reduced by the A1 receptor antagonist 8-cyclopentyl-1,3-dimethylxanthine (CPT). However, the presence of the A1 antagonist in the perfusate did not block responses induced by ATP. Ca(2+) responses evoked by stimulation of the motor nerve were reduced in the presence of CPT, whereas atropine almost completely abolished them. Ca(2+) responses were further reduced when both antagonists were present simultaneously. Hence, PSCs at the mammalian NMJ respond to the release of neurotransmitter induced by stimulation of the motor nerve through the activation of muscarinic and adenosine A1 receptors.
Figures
Fig. 1.
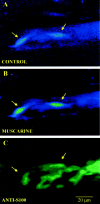
Identification of PSCs at the mammalian NMJ.A, False color confocal image of a mammalian NMJ loaded with the fluorescent Ca2+ indicator fluo-3 AM. The range of false colors reflects the level of Ca2+level, where blue indicates a low level of Ca2+, and green–red indicates a high level. Two PSCs (arrows) at rest before local application of muscarine. B, The same PSCs as in_A_, after application of muscarine (20 μ
m
). Note the rise in fluorescence induced by muscarine. C, Labeling of PSCs of the same NMJ with anti-S100, a calcium binding protein used as a general marker for Schwann cells. Note that the two cells that responded to muscarine were also labeled by the S100 antibody. Scale bar, 20 μm.
Fig. 2.
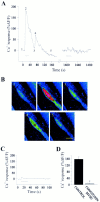
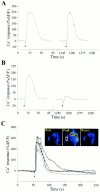
Nerve-evoked Ca2+ responses in PSCs. Ca2+ responses obtained using the fluorescent Ca2+ indicator fluo-3 AM and monitored using a Bio-Rad 600 confocal microscope. Blue indicates low level of calcium, and red indicates a high level.A, Changes in fluorescence (%Δ_F_/F) before, during (bar), and after motor nerve stimulation (50 Hz, 30 sec). Note that relative increase in Ca2+fluorescence to a second train of stimuli applied 20 min later (break in the x_-axis) was much reduced. B, Ca2+ response in the same PSC as in_A, before (1), during (2), and after (3–5) transmitter release induced by repetitive stimulation of the motor nerve (50 Hz, 30 sec). The corresponding time at which each image was taken is illustrated on the graph in A with the corresponding number of the figure above. C, Changes in fluorescence (%Δ_F_/F) before, during (bar), and after motor nerve stimulation (50 Hz, 30 sec) in the presence of ω-conotoxin MVIIC (1 μ
m
). Note that the increase in the intensity of the fluorescence was strongly reduced when transmitter release was blocked by ω-conotoxin MVIIC, a P/Q-type Ca2+ channel blocker. Different preparation than A and B.D, Mean ± SEM of amplitude of Ca2+ responses in PSCs elicited by nerve stimulation in the absence and in the presence of ω-conotoxin MVIIC (p = 0.001; Student's paired_t_ test). Scale bar: B, 10 μm.
Fig. 3.
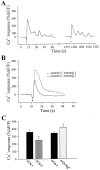
Ca2+ responses of PSCs to local application of ACh. A, Changes in fluorescence over time caused by the local application of ACh (20 μ
m
) for 200 msec in normal physiological solution. Application of ACh caused a Ca2+ response in all PSCs studied. A second application 20 min later (break in the _x_-axis) induced smaller changes in fluorescence. B, Changes in fluorescence caused by the local application of ACh (20 μ
m
, 200 msec) in the presence (solid line) and in the absence (dashed line) of external Ca2+ for the same PSCs. Ca2+ was replaced by 5 m
m
Mg2+. Note that ACh application induced larger changes in fluorescence in the absence of external Ca2+. C, Mean ± SEM of relative changes in Ca2+ responses induced by a first and a second application of ACh (20 μ
m
) and for application of ACh in absence of external Ca2+.
Fig. 4.
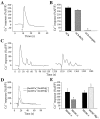
Ca2+ responses of PSCs to local application of muscarine. A, Changes in fluorescence caused by the local application of acetylcholine (20 μ
m
, 200 msec) in the presence of α-BuTx (20 μ
m
). The increase in the intensity of fluorescence induced by the local application of ACh was unaffected by α-BuTx. B, Comparison of mean ± SEM of Ca2+ responses induced by ACh alone, in the presence of α-BuTx, and in the presence of atropine. C, Changes in fluorescence over time caused by the local application of muscarine (20 μ
m
) for 200 msec in normal physiological solution. Application of muscarine caused a Ca2+ response in all PSCs studied. A second application 20 min later (break in the _x_-axis) induced smaller changes in fluorescence. D, Changes in fluorescence caused by the local application of muscarine (20 μ
m
) in the presence (solid line) and in the absence (dashed line) of external Ca2+ for the same PSCs. Ca2+ was replaced by 5 m
m
Mg2+. Note that muscarine induced larger changes in fluorescence in the absence of external Ca2+. E, Comparison of mean ± SEM of Ca2+ responses induced by a first and a second application of muscarine (left) and application of muscarine in presence and absence of external Ca2+ (right).
Fig. 5.
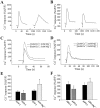
Ca2+ responses of PSCs to local application of ATP and adenosine. A, Changes in fluorescence over time caused by the local application of ATP (20 μ
m
) for 200 msec in normal physiological solution. Application of ATP caused a Ca2+ response in all PSCs studied. A second application 20 min later (break in the_x_-axis) induced smaller changes in fluorescence.B, Changes in fluorescence over time caused by the local application of adenosine (20 μ
m
) for 200 msec in normal physiological solution. Application of adenosine caused a Ca2+ response in all PSCs studied. A second application 20 min later (break in the _x_-axis) induced smaller changes in fluorescence. C, Changes in fluorescence caused by the local application of ATP (20 μ
m
, 200 msec) in the presence (solid line) and in the absence (dashed line) of external Ca2+ for the same PSCs. Note that ATP induced larger changes in fluorescence in the absence of external Ca2+. D, Changes in fluorescence caused by the local application of adenosine in the presence (solid line) and in the absence (dashed line) of external Ca2+ for the same PSCs. Note that adenosine induced larger changes in fluorescence in the absence of external Ca2+. E, Comparison of mean ± SEM of Ca2+ responses induced by a first and a second application of ATP (left) and the application of ATP in the presence and in the absence of external Ca2+ (right).F, Comparison of mean ± SEM of Ca2+ responses induced by a first and a second application of adenosine (left) and application of adenosine in the presence and in the absence of external Ca2+ (right).
Fig. 6.
Ca2+ responses of PSCs to local application of ATP and adenosine in presence of purinergic antagonists.A, Changes in fluorescence caused by the local application of ATP before and after (break in the_x_-axis) a 20 min perfusion with suramin (100 μ
m
), a nonspecific P2 antagonist. Note that the increase in the intensity of fluorescence induced by the local application of ATP was unaffected by the presence of suramin. B, Changes in fluorescence caused by the local application of adenosine before and after a 20 min perfusion with CPT (10 μ
m
).C, Changes in fluorescence in four PSCs of an NMJ caused by the local application of ATP in the presence of the A1 receptor antagonist CPT (20 μ
m
). Inset, False color confocal images of the four PSCs at rest (Rest), at the peak of the Ca2+ response (Peak), and after recovery (Recov). Note that the increase in the intensity of fluorescence induced by the local application of ATP was unaffected by the presence of CPT. Scale bar, 10 μm.
Fig. 7.
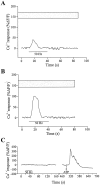
Nerve-evoked Ca2+ responses in PSCs in presence of atropine and CPT. A, Changes in fluorescence of a PSC before, during (bar), and after repetitive motor nerve stimulation (50 Hz, 30 sec) after 20 min perfusion with atropine (20 μ
m
), a muscarinic antagonist. The boxed gray zone illustrates the mean ± SEM of nerve-evoked Ca2+ responses obtained from the 10 PSCs in absence of any antagonists (Fig. 2_A_).B, Changes in fluorescence of a PSC before, during (bar), and after repetitive motor nerve stimulation (50 Hz, 30 sec) after 20 min perfusion with CPT (10 μ
m
), an A1 antagonist. The gray zone illustrates the mean ± SEM of nerve-evoked Ca2+ responses obtained from the 10 cells in absence of any antagonists. _C,_Changes in fluorescence of a PSC before, during (bar), and after repetitive motor nerve stimulation (50 Hz, 30 sec) after 20 min perfusion with CPT (10 μ
m
) and atropine (20 μ
m
). Note that the repetitive stimulation of the motor nerve did not induce any Ca2+ response in the PSC. After a recovery period of 5 min, ATP (20 μ
m
) was locally applied on the PSC, which elicited a Ca2+response.
Similar articles
- Muscarinic Ca2+ responses resistant to muscarinic antagonists at perisynaptic Schwann cells of the frog neuromuscular junction.
Robitaille R, Jahromi BS, Charlton MP. Robitaille R, et al. J Physiol. 1997 Oct 15;504 ( Pt 2)(Pt 2):337-47. doi: 10.1111/j.1469-7793.1997.337be.x. J Physiol. 1997. PMID: 9365908 Free PMC article. - Modulation by adenosine of both muscarinic M1-facilitation and M2-inhibition of [3H]-acetylcholine release from the rat motor nerve terminals.
Oliveira L, Timóteo MA, Correia-de-Sá P. Oliveira L, et al. Eur J Neurosci. 2002 Jun;15(11):1728-36. doi: 10.1046/j.1460-9568.2002.02020.x. Eur J Neurosci. 2002. PMID: 12081652 - Purinergic receptors and their activation by endogenous purines at perisynaptic glial cells of the frog neuromuscular junction.
Robitaille R. Robitaille R. J Neurosci. 1995 Nov;15(11):7121-31. doi: 10.1523/JNEUROSCI.15-11-07121.1995. J Neurosci. 1995. PMID: 7472466 Free PMC article. - Purinergic Tuning of the Tripartite Neuromuscular Synapse.
Sousa-Soares C, Noronha-Matos JB, Correia-de-Sá P. Sousa-Soares C, et al. Mol Neurobiol. 2023 Jul;60(7):4084-4104. doi: 10.1007/s12035-023-03317-8. Epub 2023 Apr 5. Mol Neurobiol. 2023. PMID: 37016047 Free PMC article. Review. - Neuron-glia interactions at the neuromuscular synapse.
Todd KJ, Robitaille R. Todd KJ, et al. Novartis Found Symp. 2006;276:222-9; discussion 229-37, 275-81. Novartis Found Symp. 2006. PMID: 16805433 Review.
Cited by
- Neuronal activity regulates correlated network properties of spontaneous calcium transients in astrocytes in situ.
Aguado F, Espinosa-Parrilla JF, Carmona MA, Soriano E. Aguado F, et al. J Neurosci. 2002 Nov 1;22(21):9430-44. doi: 10.1523/JNEUROSCI.22-21-09430.2002. J Neurosci. 2002. PMID: 12417668 Free PMC article. - Modulation of synaptic transmission and analysis of neuroprotective effects of valproic Acid and derivates in rat embryonic motoneurons.
Ragancokova D, Song Y, Nau H, Dengler R, Krampfl K, Petri S. Ragancokova D, et al. Cell Mol Neurobiol. 2010 Aug;30(6):891-900. doi: 10.1007/s10571-010-9518-8. Epub 2010 Apr 27. Cell Mol Neurobiol. 2010. PMID: 20422280 Free PMC article. - Mitochondrial alarmins released by degenerating motor axon terminals activate perisynaptic Schwann cells.
Duregotti E, Negro S, Scorzeto M, Zornetta I, Dickinson BC, Chang CJ, Montecucco C, Rigoni M. Duregotti E, et al. Proc Natl Acad Sci U S A. 2015 Feb 3;112(5):E497-505. doi: 10.1073/pnas.1417108112. Epub 2015 Jan 20. Proc Natl Acad Sci U S A. 2015. PMID: 25605902 Free PMC article. - Blocking skeletal muscle DHPRs/Ryr1 prevents neuromuscular synapse loss in mutant mice deficient in type III Neuregulin 1 (CRD-Nrg1).
Liu Y, Sugiura Y, Chen F, Lee KF, Ye Q, Lin W. Liu Y, et al. PLoS Genet. 2019 Mar 14;15(3):e1007857. doi: 10.1371/journal.pgen.1007857. eCollection 2019 Mar. PLoS Genet. 2019. PMID: 30870432 Free PMC article. - Schwann cells sense and control acetylcholine spillover at the neuromuscular junction by α7 nicotinic receptors and butyrylcholinesterase.
Petrov KA, Girard E, Nikitashina AD, Colasante C, Bernard V, Nurullin L, Leroy J, Samigullin D, Colak O, Nikolsky E, Plaud B, Krejci E. Petrov KA, et al. J Neurosci. 2014 Sep 3;34(36):11870-83. doi: 10.1523/JNEUROSCI.0329-14.2014. J Neurosci. 2014. PMID: 25186736 Free PMC article.
References
- Araque A, Parpura V, Sanzgiri RP, Haydon PG. Tripartite synapses: glia, the unacknowledged partner. Trends Neurosci. 1999;22:208–215. - PubMed
- Barres BA, Chun LL, Corey DP. Ion channels in vertebrate glia. Annu Rev Neurosci. 1990;13:441–474. - PubMed
- Bezzi P, Carmignoto G, Pasti L, Vesce S, Rossi D, Rizzini BL, Pozzan T, Volterra A. Prostaglandins stimulate calcium-dependent glutamate release in astrocytes. Nature. 1998;391:281–285. - PubMed
Publication types
MeSH terms
Substances
LinkOut - more resources
Full Text Sources
Miscellaneous
