Analysis of the cat eye syndrome critical region in humans and the region of conserved synteny in mice: a search for candidate genes at or near the human chromosome 22 pericentromere - PubMed (original) (raw)
Comparative Study
. 2001 Jun;11(6):1053-70.
doi: 10.1101/gr.154901.
P Brinkman-Mills, G S Banting, S A Maier, M A Riazi, L Bridgland, S Hu, B Birren, S Minoshima, N Shimizu, H Pan, T Nguyen, F Fang, Y Fu, L Ray, H Wu, S Shaull, S Phan, Z Yao, F Chen, A Huan, P Hu, Q Wang, P Loh, S Qi, B A Roe, H E McDermid
Affiliations
- PMID: 11381032
- PMCID: PMC311098
- DOI: 10.1101/gr.154901
Comparative Study
Analysis of the cat eye syndrome critical region in humans and the region of conserved synteny in mice: a search for candidate genes at or near the human chromosome 22 pericentromere
T K Footz et al. Genome Res. 2001 Jun.
Abstract
We have sequenced a 1.1-Mb region of human chromosome 22q containing the dosage-sensitive gene(s) responsible for cat eye syndrome (CES) as well as the 450-kb homologous region on mouse chromosome 6. Fourteen putative genes were identified within or adjacent to the human CES critical region (CESCR), including three known genes (IL-17R, ATP6E, and BID) and nine novel genes, based on EST identity. Two putative genes (CECR3 and CECR9) were identified, in the absence of EST hits, by comparing segments of human and mouse genomic sequence around two solitary amplified exons, thus showing the utility of comparative genomic sequence analysis in identifying transcripts. Of the 14 genes, 10 were confirmed to be present in the mouse genomic sequence in the same order and orientation as in human. Absent from the mouse region of conserved synteny are CECR1, a promising CES candidate gene from the center of the contig, neighboring CECR4, and CECR7 and CECR8, which are located in the gene-poor proximal 400 kb of the contig. This latter proximal region, located approximately 1 Mb from the centromere, shows abundant duplicated gene fragments typical of pericentromeric DNA. The margin of this region also delineates the boundary of conserved synteny between the CESCR and mouse chromosome 6. Because the proximal CESCR appears abundant in duplicated segments and, therefore, is likely to be gene poor, we consider the putative genes identified in the distal CESCR to represent the majority of candidate genes for involvement in CES.
Figures
Figure 1
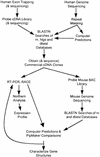
Molecular and computer-based techniques used to identify genes in the CES critical region.
Figure 2
Putative genes identified in the CES critical region (CESCR) and region of conserved synteny in mouse. Sequenced BACs and PACs (with GenBank accession nos.) are shown above (human) or below (mouse) the size scales. CpG islands in the human sequence, with their size in base pairs, are shown directly below the human size scale. Below this are the identified genes, with genes transcribed centromere to telomere above the chromosome, and genes transcribed telomere to centromere below the chromosome. The hatched section of chromosome 22 represents the region rich in duplications from other regions of the genome. The mouse genes are shown above the mouse size scale and oriented as described above. The banded section represents the portion of mouse chromosome 6 orthologous to human chromosome 12p13.
Figure 3
Percent identity plot calculated by
PipMaker
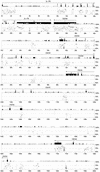
(see Methods) for the human interval of IL-17R to MIL1 compared with the sequence of the region of conserved synteny from mouse chromosome 6. Gap-free segments demonstrating >50% nucleotide identity are indicated by horizontal black bars below the graphical depictions of interspersed repeats, CpG islands, and gene structures. Exons are numbered from the 5′-most cloned exon. A single gap-free alignment underneath a protein-coding exon indicates the mouse exon size is conserved, and thus the mouse locus maintains a homologous ORF.
Figure 4
Genomic structure of the genes in the CES critical region (CESCR). Exons and introns are not shown to scale, but sizes in bp are given below the exons and above the introns. Exons are numbered from the 5′-most cloned exon; additional undiscovered exons may exist. ORFs are shown in black, 5′ UTRs in white, 3′ UTRs in grey. No significant ORFs have yet been predicted for CECR3, CECR7, or_CECR8_, hence all the exons are shown in white. Only one exon of CECR9 is currently known, therefore it was not included in this figure. CECR1 and BID were published previously (Footz et al. 1998; Riazi et al. 2000). CECR2 will be published elsewhere.
Figure 5
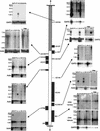
Expression analysis of genes in the CES critical region (CESCR). Genes are positioned in order along the chromosome, with Northern blots adjacent to them. The hatched section of chromosome 22 represents the region rich in duplications from other regions of the genome. For each Northern blot, a control probing with β-actin or GAPD is shown. Numbers beside the Northern blots indicate sizes in kb. (He) Heart; (Br) brain; (Pl) placenta; (Lu) lung; (Li) liver; (Sk) skeletal muscle; (Ki) kidney; (Pa) pancreas; (Mu) muscle; (Ut) uterus; (Co) colon; (Sm) small intestine; (Bl) bladder; (St) stomach; (Sp) spleen; (Th) thyroid; (Pr) prostate; (Te) testis; (Ov) ovary; (Pe) peripheral blood leukocytes.
Figure 6
Analysis of the proximal 400 kb of the human contig, showing duplications indicative of pericentromeric regions. Repeat-masked genomic sequence was compared with the Homo sapiens subset of the nonredundant (nr) and high-throughput genomic sequence database (htgs) databases. Identity to fully or partially sequenced paralogous clones is indicated as blocks between regions apparently unique to chromosome 22, with the known chromosomal locations identified. An individual chromosome may not show paralogy over the entire block. (UL) Unlocalized clones. The analysis was performed on May 10, 2000, when 80.8% of the genome was represented by draft (61.9%) and/or finished (18.9%) sequence (
http://www.ncbi.nlm.nih.gov/genome/seq/page.cgi?F=HsHome.html&ORG=Hs
). Additional paralogous segments may be found as the genome sequence is finished.
Similar articles
- The gene for death agonist BID maps to the region of human 22q11.2 duplicated in cat eye syndrome chromosomes and to mouse chromosome 6.
Footz TK, Birren B, Minoshima S, Asakawa S, Shimizu N, Riazi MA, McDermid HE. Footz TK, et al. Genomics. 1998 Aug 1;51(3):472-5. doi: 10.1006/geno.1998.5392. Genomics. 1998. PMID: 9721221 - Comparative sequence analysis of 634 kb of the mouse chromosome 16 region of conserved synteny with the human velocardiofacial syndrome region on chromosome 22q11.2.
Lund J, Chen F, Hua A, Roe B, Budarf M, Emanuel BS, Reeves RH. Lund J, et al. Genomics. 2000 Feb 1;63(3):374-83. doi: 10.1006/geno.1999.6044. Genomics. 2000. PMID: 10704284 - Three duplicons form a novel chimeric transcription unit in the pericentromeric region of chromosome 22q11.
Bridgland L, Footz TK, Kardel MD, Riazi MA, McDermid HE. Bridgland L, et al. Hum Genet. 2003 Jan;112(1):57-61. doi: 10.1007/s00439-002-0827-y. Epub 2002 Oct 29. Hum Genet. 2003. PMID: 12483300 - Clinical and molecular cytogenetic findings of cat eye syndrome and a 2-year-old patient with congenital aural atresia and hearing loss.
Xu L, Cheng X, Tang L, Min S, Wu J, Zhu H, Liao Y. Xu L, et al. BMC Pediatr. 2024 Oct 14;24(1):658. doi: 10.1186/s12887-024-05136-9. BMC Pediatr. 2024. PMID: 39402511 Free PMC article. Review. - Interstitial duplication of proximal 22q: phenotypic overlap with cat eye syndrome.
Knoll JH, Asamoah A, Pletcher BA, Wagstaff J. Knoll JH, et al. Am J Med Genet. 1995 Jan 16;55(2):221-4. doi: 10.1002/ajmg.1320550214. Am J Med Genet. 1995. PMID: 7717422 Review.
Cited by
- Generation and comparative analysis of approximately 3.3 Mb of mouse genomic sequence orthologous to the region of human chromosome 7q11.23 implicated in Williams syndrome.
DeSilva U, Elnitski L, Idol JR, Doyle JL, Gan W, Thomas JW, Schwartz S, Dietrich NL, Beckstrom-Sternberg SM, McDowell JC, Blakesley RW, Bouffard GG, Thomas PJ, Touchman JW, Miller W, Green ED. DeSilva U, et al. Genome Res. 2002 Jan;12(1):3-15. doi: 10.1101/gr.214802. Genome Res. 2002. PMID: 11779826 Free PMC article. - Lifestage Sex-Specific Genetic Effects on Metabolic Disorders in an Adult Population in Korea: The Korean Genome and Epidemiology Study.
Kim YS, Park YC, Choi JE, Park JM, Han K, Kim K, Kim BT, Hong KW. Kim YS, et al. Int J Mol Sci. 2022 Oct 6;23(19):11889. doi: 10.3390/ijms231911889. Int J Mol Sci. 2022. PMID: 36233190 Free PMC article. - Adenosine deaminase 2 activity negatively correlates with age during childhood.
Bowers SM, Gibson KM, Cabral DA, Brown KL. Bowers SM, et al. Pediatr Rheumatol Online J. 2020 Jul 10;18(1):54. doi: 10.1186/s12969-020-00446-5. Pediatr Rheumatol Online J. 2020. PMID: 32650798 Free PMC article. - Pathogenic variant c.1052T>A (p.Leu351Gln) in adenosine deaminase 2 impairs secretion and elevates type I IFN responsive gene expression.
Bowers SM, Sundqvist M, Dancey P, Cabral DA, Brown KL. Bowers SM, et al. Front Immunol. 2022 Sep 30;13:995191. doi: 10.3389/fimmu.2022.995191. eCollection 2022. Front Immunol. 2022. PMID: 36248868 Free PMC article. - lncRNAs-mRNAs Co-Expression Network Underlying Childhood B-Cell Acute Lymphoblastic Leukaemia: A Pilot Study.
Affinito O, Pane K, Smaldone G, Orlandella FM, Mirabelli P, Beneduce G, Parasole R, Ripaldi M, Salvatore M, Franzese M. Affinito O, et al. Cancers (Basel). 2020 Sep 2;12(9):2489. doi: 10.3390/cancers12092489. Cancers (Basel). 2020. PMID: 32887470 Free PMC article.
References
- Altschul SF, Gish W, Miller W, Myers EW, Lipman DJ. Basic local alignment search tool. J Mol Biol. 1990;215:403–410. - PubMed
- Ansari-Lari MA, Oeltjen JC, Schwartz S, Zhang Z, Muzny DM, Lu J, Gorrell JH, Chinault AC, Belmont JW, Miller W, Gibbs RA. Comparative sequence analysis of a gene-rich cluster at human chromosome 12p13 and its syntenic region in mouse chromosome 6. Genome Res. 1998;8:29–40. - PubMed
- Antonsson B. Phosphatidylinositol synthase from mammalian tissues. Biochim Biophys Acta. 1997;1348:179–186. - PubMed
- Baud V, Mears AJ, Lamour V, Scamps C, Duncan AM, McDermid HE, Lipinski M. The E subunit of vacuolar H(+)-ATPase localizes close to the centromere on human chromosome 22. Hum Mol Genet. 1994;3:335–339. - PubMed
- Burge C, Karlin S. Prediction of complete gene structures in human genomic DNA. J Mol Biol. 1997;268:78–94. - PubMed
Publication types
MeSH terms
LinkOut - more resources
Full Text Sources
Medical
Molecular Biology Databases
Research Materials
Miscellaneous


