Model of cellular and network mechanisms for odor-evoked temporal patterning in the locust antennal lobe - PubMed (original) (raw)
Model of cellular and network mechanisms for odor-evoked temporal patterning in the locust antennal lobe
M Bazhenov et al. Neuron. 2001 May.
Abstract
Locust antennal lobe (AL) projection neurons (PNs) respond to olfactory stimuli with sequences of depolarizing and hyperpolarizing epochs, each lasting hundreds of milliseconds. A computer simulation of an AL network was used to test the hypothesis that slow inhibitory connections between local neurons (LNs) and PNs are responsible for temporal patterning. Activation of slow inhibitory receptors on PNs by the same GABAergic synapses that underlie fast oscillatory synchronization of PNs was sufficient to shape slow response modulations. This slow stimulus- and neuron-specific patterning of AL activity was resistant to blockade of fast inhibition. Fast and slow inhibitory mechanisms at synapses between LNs and PNs can thus form dynamical PN assemblies whose elements synchronize transiently and oscillate collectively, as observed not only in the locust AL, but also in the vertebrate olfactory bulb.
Figures
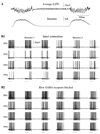
Figure 1. Odor-Specific Slow Temporal Patterns in Locust PNs
Simultaneous intracellular recordings from 3 PNs show odor-specific slow temporal patterns. The odor responses in each PN are shown for two different stimuli (gray bars). (A) PNs membrane potentials. (B) PSTHs corresponding to the spike trains shown in (A), (12 trials).
Figure 2. Network Properties
(A) A simulated network model consisted of 90 PNs and 30 LNs. All interconnections were random with probability 0.5. Forty percent of PNs and 30% of LNs were stimulated by current pulses. Dashed lines illustrate connections to the rest of the network. (B) Fast GABAA IPSPs (dashed line) and the sum of fast GABAA and slow GABA IPSPs (solid line) are shown for three different inputs—different numbers of presynaptic spikes.
Figure 3. Oscillation in Response to External Stimulation
(A) Two sequential stimuli each lasting 500 ms were delivered with 2500 ms delay to a randomly selected subset of PNs and LNs (40% and 30% of the total populations, respectively). Field potential oscillations (upper panel) and stimulus (lower panel) are shown. (B) Effect of slow inhibition on temporal patterning. Four representative examples of PNs are shown in response to three presentations of two different stimuli. Stimuli (500 ms duration) are marked by horizontal bars. (B1) Stimulus-specific slow temporal structure was found in the network with intact slow inhibition. (B2) Blocking the slow inhibitory receptors eliminated temporal patterning.
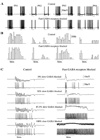
Figure 4. Disinhibition in LN-PN Network
(A) Four representative PNs from intact (upper panels) and disinhibited (lower panels) networks. In disinhibited network, peak conductance for GABAA synapses was reduced by a factor of 50. It was not completely eliminated because it is likely that, in physiological experiments with PCT, a small fraction of the fast inhibitory channels remained unaffected. Slow inhibition was preserved in both models. (B) PSTHs (four trials) for the same neurons from intact (upper panels) and disinhibited (lower panels) networks. The slow temporal structure was remained intact after fast inhibitory receptors were blocked. (C) The maximal conductance for slow inhibitory receptors was gradually decreased from 100% to zero in intact (left) and disinhibited (right) networks. When both fast and slow inhibitions were blocked (right, bottom), PNs continued to fire even between stimuli. Top trace, LFP, and second trace down, PN.
Figure 5. Effect of Kinetic Parameters and Spatial Density of Slow Inhibitory Receptors
(A) Increase (left) or decrease (right) in decay time constant for slow inhibition significantly decrease or increase, respectively, the network response. Insets show slow IPSPs in response to 2 presynaptic spikes before modification (dashed line) and after modification (solid line). (B) Increase (left) or decrease (right) of the density of slow GABAergic interconnections led to relatively small changes in PN activity. In 2D panels, y axis represents PN label (1–90).
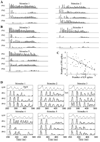
Figure 6. Temporal Structure of PN Activity during Different Stimuli
PSTHs for 4 representative PNs during five stimulus presentations are shown. (A) The same two stimuli as in Figure 3B are shown—identical PNs but different LNs were stimulated. (B) Spatially overlapping stimuli: 50% overlap between stimuli 3 and 4 and 90% overlap between stimuli 3 and 5. (C) Total number of Ca2+ spikes in all presynaptic LNs versus number of spikes in their postsynaptic PN at each cycle of population oscillations. Different symbols indicate results for different PNs. (D) Field potential (top) and 3 different PNs are shown in response to six different stimuli. First six cycles of network oscillations following stimulus onset are presented.
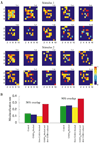
Figure 7. Temporal Structure of PN Responses and Stimulus Discrimination
(A) Spatiotemporal dynamics of the PNs during two different stimulus presentations (90% spatial overlap between stimuli). Each plot (9 × 10) corresponds to one cycle of the field potential oscillation (10 cycles are shown for each stimulus). Light color shows the presence of an action potential and characterizes its phase relative to the nearest peak of the field potential (red corresponds to precise synchronization—zero phase shift, light blue indicates a spike occurring precisely between two peaks of the field potential—±π phase shift). Dark blue color indicates silent cells. (B) Misclassification rate calculated for all PNs using cluster algorithm (τ = 200 ms). Intact network (green); maximal conductance for GABAA synapses reduced by factor of 50 (blue); slow inhibitory receptors blocked (yellow); maximal conductance for GABAA synapses reduced by factor of 50 and maximal conductance for slow inhibitory receptors reduced by factor of 8 (red). Stimuli with different degrees of spatial overlap (50% and 90%) are shown. Misclassification rate of 0.5 indicates a complete loss of discriminability.
Comment in
- Smelling well with a code in the nodes.
Gelperin A. Gelperin A. Neuron. 2001 May;30(2):307-9. doi: 10.1016/s0896-6273(01)00310-5. Neuron. 2001. PMID: 11394993 Review. No abstract available.
Similar articles
- Model of transient oscillatory synchronization in the locust antennal lobe.
Bazhenov M, Stopfer M, Rabinovich M, Huerta R, Abarbanel HD, Sejnowski TJ, Laurent G. Bazhenov M, et al. Neuron. 2001 May;30(2):553-67. doi: 10.1016/s0896-6273(01)00284-7. Neuron. 2001. PMID: 11395014 Free PMC article. - A large-scale model of the locust antennal lobe.
Patel M, Rangan AV, Cai D. Patel M, et al. J Comput Neurosci. 2009 Dec;27(3):553-67. doi: 10.1007/s10827-009-0169-z. Epub 2009 Jun 23. J Comput Neurosci. 2009. PMID: 19548077 Free PMC article. - Relationship between afferent and central temporal patterns in the locust olfactory system.
Wehr M, Laurent G. Wehr M, et al. J Neurosci. 1999 Jan 1;19(1):381-90. doi: 10.1523/JNEUROSCI.19-01-00381.1999. J Neurosci. 1999. PMID: 9870967 Free PMC article. - GABAergic mechanisms that shape the temporal response to odors in moth olfactory projection neurons.
Christensen TA, Waldrop BR, Hildebrand JG. Christensen TA, et al. Ann N Y Acad Sci. 1998 Nov 30;855:475-81. doi: 10.1111/j.1749-6632.1998.tb10608.x. Ann N Y Acad Sci. 1998. PMID: 9929641 Review. - Synaptic transmission and modulation in the olfactory bulb.
Trombley PQ, Shepherd GM. Trombley PQ, et al. Curr Opin Neurobiol. 1993 Aug;3(4):540-7. doi: 10.1016/0959-4388(93)90053-2. Curr Opin Neurobiol. 1993. PMID: 8219719 Review.
Cited by
- Neuronal Sequence Models for Bayesian Online Inference.
Frölich S, Marković D, Kiebel SJ. Frölich S, et al. Front Artif Intell. 2021 May 21;4:530937. doi: 10.3389/frai.2021.530937. eCollection 2021. Front Artif Intell. 2021. PMID: 34095815 Free PMC article. Review. - A lightweight data-driven spiking neuronal network model of Drosophila olfactory nervous system with dedicated hardware support.
Nanami T, Yamada D, Someya M, Hige T, Kazama H, Kohno T. Nanami T, et al. Front Neurosci. 2024 Jun 26;18:1384336. doi: 10.3389/fnins.2024.1384336. eCollection 2024. Front Neurosci. 2024. PMID: 38994271 Free PMC article. - Design parameters of the fan-out phase of sensory systems.
García-Sanchez M, Huerta R. García-Sanchez M, et al. J Comput Neurosci. 2003 Jul-Aug;15(1):5-17. doi: 10.1023/a:1024460700856. J Comput Neurosci. 2003. PMID: 12843691 - Non-synaptic interactions between olfactory receptor neurons, a possible key feature of odor processing in flies.
Pannunzi M, Nowotny T. Pannunzi M, et al. PLoS Comput Biol. 2021 Dec 13;17(12):e1009583. doi: 10.1371/journal.pcbi.1009583. eCollection 2021 Dec. PLoS Comput Biol. 2021. PMID: 34898600 Free PMC article. - A model of stimulus-specific neural assemblies in the insect antennal lobe.
Martinez D, Montejo N. Martinez D, et al. PLoS Comput Biol. 2008 Aug 1;4(8):e1000139. doi: 10.1371/journal.pcbi.1000139. PLoS Comput Biol. 2008. PMID: 18795147 Free PMC article.
References
- Bazhenov M, Timofeev I, Steriade M, Sejnowski TJ. Cellular and network models for intrathalamic augmenting responses during 10 Hz stimulation. J. Neurophysiol. 1998;79:2730–2748. - PubMed
- Burrows M, Boeckh J, Esslen J. Physiological and morphological properties of interneurons in the deutocerebrum of male cockroaches which respond to female pheromone. J. Comp. Physiol. A. 1982;145:447–457.
- Chaput M, Holley A. Single unit responses of olfactory bulb neurons to odor presentation in awake rabbits. J. Physiol. 1980;76:551–558. - PubMed
- Christensen T, Hildebrand J. Male-specific, sex phero-mone-selective projection neurons in the antennal lobes of the moth Manduca sexta. J. Comp. Physiol. A. 1987;160:553–569. - PubMed
Publication types
MeSH terms
Substances
LinkOut - more resources
Full Text Sources


