Network synchrony in the nucleus accumbens in vivo - PubMed (original) (raw)
Network synchrony in the nucleus accumbens in vivo
Y Goto et al. J Neurosci. 2001.
Abstract
Nucleus accumbens neurons show membrane potential fluctuations between a very negative resting membrane potential and periodical plateau depolarizations. Because action potential firing occurs only during the depolarized state, the control of transitions between states is important for information processing within this region, with an impact on accumbens-related behaviors. It has been proposed that ensembles of active neurons in the nucleus accumbens could be based on a population of cells depolarizing simultaneously into the UP state. In this study, in vivo intracellular recordings from accumbens neurons were performed simultaneously with local field potential recordings to examine whether the nucleus accumbens can exhibit synchronization of membrane potential states in a population of neurons. These simultaneous recordings indicated that local field potential shifts occurred synchronously with transitions to the UP state. Furthermore, manipulations that evoked prolonged plateau depolarizations also evoked field potentials of similar duration. Such signals likely occurred because of simultaneous membrane potential changes in a population of neurons. Together with our previous studies, these results suggest that membrane potential states in the nucleus accumbens can be synchronized by synaptic inputs from the hippocampus.
Figures
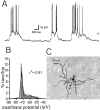
Fig. 1.
Nucleus accumbens medium spiny neurons exhibit a membrane potential with UP and DOWN states. A, A representative trace of a neuron with alternating DOWN (−72 mV;bottom arrowhead) and UP (−59 mV; top arrowhead) membrane potential states. B, Membrane potential distribution of the trace shown in _A_reveals two peaks that correspond to the UP and DOWN states. This histogram fits to a two-peak Gaussian distribution (black line; _r_2 = 0.91).C, Neurobiotin staining revealed morphology typical of medium spiny neurons.
Fig. 2.
Membrane potential transitions are correlated with local field potentials in the NAcc.A, Example of a local field potential recording showing negative shifts (top trace, _dashed line_indicates 0 V) simultaneously with UP state transitions in the NAcc neurons (bottom trace, _dashed line_indicates the DOWN state, −78 mV). High-frequency components including spike firing were removed from both traces by low-pass filtering (<50 Hz). _B_, Cross-correlogram from the pair illustrated in_A_ (bin width = 100 msec) showing a peak at time 0 bin. The _dashed line_ indicates 3 SDs above the mean._C_, A control cross-correlogram was made using shuffled periods of intracellular and local field potential recordings._D_, Linear regression analysis between the distances separating intracellular from extracellular recording electrodes and strength of cross-correlation showing decreasing_S_ccr with increasing distances. The_arrow_ indicates the case shown in _A_._E_, Multiunit recordings showing spike firing occurring during negative shifts of local field potential. Both traces are the same data sample; the _top trace_ was high-pass filtered (>50 Hz) to reveal spike firing, whereas the bottom trace was low-pass filtered (<50 Hz) to show slow negative local field potential shifts. F, Locations of intracellular and local field potential recording sites. All intracellular recordings were obtained from the core region except one that was located in the shell. All local field potential recordings were performed in the core region.
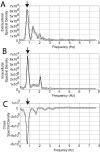
Fig. 3.
Spectral density coherency analyses reveal high synchrony between intracellular recordings and local field potential fluctuations. A, Spectral density of the extracellular recording shown in Figure 2_A_. The_arrow_ indicates the peak that corresponds to the frequency of local field potential shifts (0.76 Hz). B, Spectral density of an intracellular recording obtained simultaneously. A peak (arrow) is observed at the same frequency as in_A_. C, Cross-spectral density revealed a peak (arrow) at the same frequency as in_A_ and B. Zero is the value expected for nonsynchronous components. The near 1 Hz peak has a negative value in this case, resulting from the 180° off-phase of both waveforms. (The intracellular signal depolarizes as the field potential turns more negative.) All graphs plot microvolts per square second over Hz.
Fig. 4.
A fornix transection eliminated local field potentials in the NAcc. A, Traces of local field potential before (top) and after (bottom) fornix transection. B, Traces of local field potential before (top) and after (bottom) a transection that spared the fornix. C, Schematic description of fornix and sham transections. In the sham operation, the transection was stopped before the knife reached the fornix.
Fig. 5.
Simultaneous intracellular and extracellular responses to VTA stimulation recorded in the NAcc.A, Typical example of simultaneously recorded traces. Trains of five pulses delivered to the VTA appear as sets of vertical lines. Top, Overlay of five local field potentials showing negative shifts in response to VTA stimulation.Bottom, Overlay of five intracellular recordings simultaneously recorded with local field potentials shown in top traces. B, Averaged signals from 15 responses to VTA stimulation. Evoked field potential negative shifts (top) were observed simultaneously with membrane potential depolarizations (bottom).
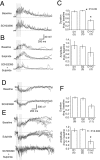
Fig. 6.
Dopamine antagonists altered responses to VTA stimulation. A, Traces showing a prolonged depolarization resembling the UP state in response to VTA stimulation (vertical lines) before (top) and after (bottom) applying the dopamine D1 antagonist SCH23390 (0.5 mg/kg). Both traces are overlays of five responses.B, Traces from another cell showing a similar response in control conditions (top), with the D2antagonist sulpiride (40 mg/kg) (middle), and with the D1 and D2 antagonists combined (bottom). C, Bar graphs showing the duration and amplitude of VTA-evoked depolarization obtained in the presence of these drugs as a proportion of the baseline responses. A combined administration of D1 and D2antagonists reduced the duration of VTA-evoked responses.Numbers in parentheses indicate the number of samples. D, Negative field potential shifts evoked by VTA stimulation in control conditions (top) and in the presence of SCH23390 (bottom). Traces are overlays of five responses. E, Similar response before (top) and after drug administration (middle, with sulpiride; bottom, with a combination of SCH23390 and sulpiride). Again, traces are overlays of five responses. F, Bar graphs summarizing changes in the duration and amplitude of VTA-evoked events with dopamine antagonist treatment. As with intracellular recordings, a combined administration of D1 and D2 antagonists reduced the duration of local field potential responses.
Similar articles
- Dopaminergic modulation of prefrontal cortical input to nucleus accumbens neurons in vivo.
Brady AM, O'Donnell P. Brady AM, et al. J Neurosci. 2004 Feb 4;24(5):1040-9. doi: 10.1523/JNEUROSCI.4178-03.2004. J Neurosci. 2004. PMID: 14762122 Free PMC article. - Modulation of hippocampal and amygdalar-evoked activity of nucleus accumbens neurons by dopamine: cellular mechanisms of input selection.
Floresco SB, Blaha CD, Yang CR, Phillips AG. Floresco SB, et al. J Neurosci. 2001 Apr 15;21(8):2851-60. doi: 10.1523/JNEUROSCI.21-08-02851.2001. J Neurosci. 2001. PMID: 11306637 Free PMC article. - Cooperative activation of dopamine D1 and D2 receptors increases spike firing of nucleus accumbens neurons via G-protein betagamma subunits.
Hopf FW, Cascini MG, Gordon AS, Diamond I, Bonci A. Hopf FW, et al. J Neurosci. 2003 Jun 15;23(12):5079-87. doi: 10.1523/JNEUROSCI.23-12-05079.2003. J Neurosci. 2003. PMID: 12832531 Free PMC article. - Neuromodulatory action of dopamine in the nucleus accumbens: an in vivo intracellular study.
Yim CY, Mogenson GJ. Yim CY, et al. Neuroscience. 1988 Aug;26(2):403-15. doi: 10.1016/0306-4522(88)90158-3. Neuroscience. 1988. PMID: 3173682 - Examination of factors mediating the transition to behaviorally correlated nucleus accumbens cell firing during cocaine self-administration sessions in rats.
Carelli RM, Ijames S, Konstantopoulos J, Deadwyler SA. Carelli RM, et al. Behav Brain Res. 1999 Oct;104(1-2):127-39. doi: 10.1016/s0166-4328(99)00064-9. Behav Brain Res. 1999. PMID: 11125731
Cited by
- Dopaminergic modulation of striatal plateau depolarizations in corticostriatal organotypic cocultures.
Tseng KY, Snyder-Keller A, O'Donnell P. Tseng KY, et al. Psychopharmacology (Berl). 2007 Apr;191(3):627-40. doi: 10.1007/s00213-006-0439-7. Epub 2006 Jun 7. Psychopharmacology (Berl). 2007. PMID: 16758237 Free PMC article. - Identifying cardiorespiratory neurocircuitry involved in central command during exercise in humans.
Green AL, Wang S, Purvis S, Owen SL, Bain PG, Stein JF, Guz A, Aziz TZ, Paterson DJ. Green AL, et al. J Physiol. 2007 Jan 15;578(Pt 2):605-12. doi: 10.1113/jphysiol.2006.122549. Epub 2006 Nov 2. J Physiol. 2007. PMID: 17082229 Free PMC article. Clinical Trial. - D2 dopamine modulation of corticoaccumbens synaptic responses changes during adolescence.
Benoit-Marand M, O'Donnell P. Benoit-Marand M, et al. Eur J Neurosci. 2008 Mar;27(6):1364-72. doi: 10.1111/j.1460-9568.2008.06107.x. Epub 2008 Mar 7. Eur J Neurosci. 2008. PMID: 18331340 Free PMC article. - Toward a neurobiology of delusions.
Corlett PR, Taylor JR, Wang XJ, Fletcher PC, Krystal JH. Corlett PR, et al. Prog Neurobiol. 2010 Nov;92(3):345-69. doi: 10.1016/j.pneurobio.2010.06.007. Epub 2010 Jun 15. Prog Neurobiol. 2010. PMID: 20558235 Free PMC article. Review. - Directional analysis of coherent oscillatory field potentials in the cerebral cortex and basal ganglia of the rat.
Sharott A, Magill PJ, Bolam JP, Brown P. Sharott A, et al. J Physiol. 2005 Feb 1;562(Pt 3):951-63. doi: 10.1113/jphysiol.2004.073189. Epub 2004 Nov 18. J Physiol. 2005. PMID: 15550466 Free PMC article.
References
- Anderson J, Lampl I, Reichova I, Carandini M, Ferster D. Stimulus dependence of two-state fluctuations of membrane potential in cat visual cortex. Nat Neurosci. 2000;3:617–621. - PubMed
- Apicella P, Ljungberg T, Scarnati E, Schultz W. Responses to reward in monkey dorsal and ventral striatum. Exp Brain Res. 1991;85:491–500. - PubMed
- Chang HT, Kitai ST. Projection neurons of the nucleus accumbens: an intracellular labeling study. Brain Res. 1985;208:112–116. - PubMed
- Deadwyler SA, Hampson RE. Ensemble activity and behavior: what's the code? Science. 1995;270:1316–1318. - PubMed
Publication types
MeSH terms
Substances
Grants and funding
- R56 MH057683/MH/NIMH NIH HHS/United States
- MH60131/MH/NIMH NIH HHS/United States
- R01 MH057683/MH/NIMH NIH HHS/United States
- MH57683/MH/NIMH NIH HHS/United States
- R01 MH060131/MH/NIMH NIH HHS/United States
LinkOut - more resources
Full Text Sources
Other Literature Sources


