Decay kinetics of human immunodeficiency virus-specific CD8+ T cells in peripheral blood after initiation of highly active antiretroviral therapy - PubMed (original) (raw)
Comparative Study
Decay kinetics of human immunodeficiency virus-specific CD8+ T cells in peripheral blood after initiation of highly active antiretroviral therapy
J P Casazza et al. J Virol. 2001 Jul.
Abstract
We measured the longitudinal responses to 95 HLA class I-restricted human immunodeficiency virus (HIV) epitopes and an immunodominant HLA A2-restricted cytomegalovirus (CMV) epitope in eight treatment-naive HIV-infected individuals, using intracellular cytokine staining. Patients were treated with highly active antiretroviral therapy (HAART) for a median of 78 weeks (range, 34 to 121 weeks). Seven of eight patients maintained an undetectable viral load for the duration of therapy. A rapid decline in HIV-specific CD8(+) T-cell response was observed at initiation of therapy. After an undetectable viral load was achieved, a slower decrease in HIV-specific CD8(+) T-cell response was observed that was well described by first-order kinetics. The median half-life for the rate of decay was 38.8 (20.3 to 68.0) weeks when data were expressed as percentage of peripheral CD8(+) T cells. In most cases, data were similar when expressed as the number of responding CD8(+) T cells per microliter of blood. In subjects who responded to more than one HIV epitope, rates of decline in response to the different epitopes were similar and varied by a factor of 2.2 or less. Discontinuation of treatment resulted in a rapid increase in HIV-specific CD8(+) T cells. Responses to CMV increased 1.6- and 2.8-fold within 16 weeks of initiation of HAART in two of three patients with a measurable CMV response. These data suggest that HAART quickly starts to restore CD8(+) T-cell responses to other chronic viral infections and leads to a slow decrease in HIV-specific CD8(+) T-cell response in HIV-infected patients. The slow decrease in the rate of CD8(+) T-cell response and rapid increase in response to recurrent viral replication suggest that the decrease in CD8(+) T-cell response observed represents a normal memory response to withdrawal of antigen.
Figures
FIG. 1
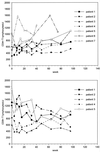
Plot of HIV load versus time of therapy. Viral loads at week 0 are from samples drawn at initiation of therapy.
FIG. 2
Plots of CD4+ and CD8+ T cells per microliter of blood versus time of therapy.
FIG. 3
FACS plots of longitudinal CD8+ T-cell response to peptide p24 259–267 from patient 4. Darkened dots represent responsive CD8+ T cells as judged by staining with anti-CD69-PE and anti-IFN-γ-FITC. Weeks after initiation of therapy and percent response are indicated in the upper right corner of each plot. The blank shown represents PBMC incubated with anti-CD28 and anti-CD49d in the absence of peptide for cells from day 0. Separate blanks were run for each time point and ranged between 0.03 and 0.07% for this patient.
FIG. 4
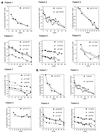
(a) Plots of the natural log of percent responding CD8+ T cells versus time of therapy. Responses for specific HIV epitopes for both plots are as indicated in the graphs. Straight lines represent linear regressions based on data obtained from blood samples taken after viral load became undetectable. (b) Plots of the natural log of number of responding CD8+ T cells per microliter of blood versus time of therapy. Responses for specific HIV epitopes for both plots are as indicated in the graphs. Straight lines represent linear regressions based on data obtained from blood samples taken after viral load became undetectable.
FIG. 5
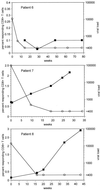
Plot of percent CD8+ T cells responding to peptide p17 77-85 (■) and viral load (○) in a patient who discontinued all antiretroviral drug therapy for a 1.5-week period prior to his 51-week clinic visit, as indicated by the open bar above the x axis. The limit of detection for HIV load was 400 copies/ml.
FIG. 6
HIV load (○) and CD8+ T-cell response to CMV epitope pp65 NLMVPMVATV (■) in three HLA A2+ individuals. Day 0 is the day of HAART initiation. The lower limit of detection for HIV viral load was 400 copies/ml.
Similar articles
- Dynamics of HIV-specific CD8+ T lymphocytes with changes in viral load.The RESTIM and COMET Study Groups.
Mollet L, Li TS, Samri A, Tournay C, Tubiana R, Calvez V, Debré P, Katlama C, Autran B. Mollet L, et al. J Immunol. 2000 Aug 1;165(3):1692-704. doi: 10.4049/jimmunol.165.3.1692. J Immunol. 2000. PMID: 10903781 Clinical Trial. - Human immunodeficiency virus-infected patients receiving highly active antiretroviral therapy maintain activated CD8+ T cell subsets as a strong adaptive immune response to cytomegalovirus.
Villacres MC, Lacey SF, La Rosa C, Krishnan R, Auge C, Longmate J, Zaia JA, Leedom JM, Diamond DJ. Villacres MC, et al. J Infect Dis. 2001 Aug 1;184(3):256-67. doi: 10.1086/322028. Epub 2001 Jul 10. J Infect Dis. 2001. PMID: 11443550 - Functional restoration of human immunodeficiency virus and Epstein-Barr virus-specific CD8(+) T cells during highly active antiretroviral therapy is associated with an increase in CD4(+) T cells.
Kostense S, Otto SA, Knol GJ, Manting EH, Nanlohy NM, Jansen C, Lange JM, van Oers MH, Miedema F, van Baarle D. Kostense S, et al. Eur J Immunol. 2002 Apr;32(4):1080-9. doi: 10.1002/1521-4141(200204)32:4<1080::AID-IMMU1080>3.0.CO;2-R. Eur J Immunol. 2002. PMID: 11920575 - Partners in Crime: The Role of CMV in Immune Dysregulation and Clinical Outcome During HIV Infection.
Freeman ML, Lederman MM, Gianella S. Freeman ML, et al. Curr HIV/AIDS Rep. 2016 Feb;13(1):10-9. doi: 10.1007/s11904-016-0297-9. Curr HIV/AIDS Rep. 2016. PMID: 26810437 Free PMC article. Review. - Functions of tetramer-stained HIV-specific CD4(+) and CD8(+) T cells.
Kelleher AD, Rowland-Jones SL. Kelleher AD, et al. Curr Opin Immunol. 2000 Aug;12(4):370-4. doi: 10.1016/s0952-7915(00)00102-3. Curr Opin Immunol. 2000. PMID: 10899020 Review.
Cited by
- Epitope-dependent effect of long-term cART on maintenance and recovery of HIV-1-specific CD8+ T cells.
Kuse N, Gatanaga H, Zhang Y, Chikata T, Oka S, Takiguchi M. Kuse N, et al. J Virol. 2023 Nov 30;97(11):e0102423. doi: 10.1128/jvi.01024-23. Epub 2023 Oct 25. J Virol. 2023. PMID: 37877716 Free PMC article. - Administration of broadly neutralizing anti-HIV-1 antibodies at ART initiation maintains long-term CD8+ T cell immunity.
Rosás-Umbert M, Gunst JD, Pahus MH, Olesen R, Schleimann M, Denton PW, Ramos V, Ward A, Kinloch NN, Copertino DC, Escribà T, Llano A, Brumme ZL, Brad Jones R, Mothe B, Brander C, Fox J, Nussenzweig MC, Fidler S, Caskey M, Tolstrup M, Søgaard OS. Rosás-Umbert M, et al. Nat Commun. 2022 Oct 29;13(1):6473. doi: 10.1038/s41467-022-34171-2. Nat Commun. 2022. PMID: 36309514 Free PMC article. - Memory CD4+ T cells that co-express PD1 and CTLA4 have reduced response to activating stimuli facilitating HIV latency.
Rasmussen TA, Zerbato JM, Rhodes A, Tumpach C, Dantanarayana A, McMahon JH, Lau JSY, Chang JJ, Gubser C, Brown W, Hoh R, Krone M, Pascoe R, Chiu CY, Bramhall M, Lee HJ, Haque A, Fromentin R, Chomont N, Milush J, Van der Sluis RM, Palmer S, Deeks SG, Cameron PU, Evans V, Lewin SR. Rasmussen TA, et al. Cell Rep Med. 2022 Oct 18;3(10):100766. doi: 10.1016/j.xcrm.2022.100766. Epub 2022 Oct 4. Cell Rep Med. 2022. PMID: 36198308 Free PMC article. - T-cell activation state differentially contributes to neuropsychiatric complications in women with HIV.
Williams DW, Flores BR, Xu Y, Wang Y, Yu D, Peters BA, Adedimeji A, Wilson TE, Merenstein D, Tien PC, Cohen MH, Weber KM, Adimora AA, Ofotokun I, Fischl M, Turan J, Turan B, Laumet G, Landay AL, Dastgheyb RM, Gange SJ, Weiser SD, Rubin LH. Williams DW, et al. Brain Behav Immun Health. 2022 Aug 29;25:100498. doi: 10.1016/j.bbih.2022.100498. eCollection 2022 Nov. Brain Behav Immun Health. 2022. PMID: 36097532 Free PMC article. - Pre-cART Immune Parameters in People Living With HIV Might Help Predict CD8+ T-Cell Characteristics, Inflammation Levels, and Reservoir Composition After Effective cART.
Salido J, Czernikier A, Trifone C, Polo ML, Figueroa MI, Urioste A, Cahn P, Sued O, Salomon H, Laufer N, Ghiglione Y, Turk G. Salido J, et al. Pathog Immun. 2021 Oct 1;6(2):60-89. doi: 10.20411/pai.v6i2.447. eCollection 2021. Pathog Immun. 2021. PMID: 34988339 Free PMC article.
References
- Dalod M, Dupuis M, Deschemin J C, Sicard D, Salmon D, Delfraissy J F, Venet A, Sinet M, Guillet J G. Broad, intense anti-human immunodeficiency virus (HIV) ex vivo CD8+ responses in HIV type 1-infected patients: comparison with anti-Epstein-Barr virus responses and changes during antiretroviral therapy. J Virol. 1999;73:7108–7116. - PMC - PubMed
- Goulder P J R, Tang Y, Brander C, Betts M R, Trocha A K, He S, Rosenberg E S, Ogg G, Kalams S A, McKinney R E, Mayer K, Koup R A, Pelton S I, Burchett S K, McIntosh K, Walker B D. Functionally inert HIV-specific cytotoxic T lymphocytes do not play a major role in chronically infected adults and children. J Exp Med. 2000;192:1819–1832. - PMC - PubMed
- Gray C M, Lawrence J, Schapiro J M, Altman J D, Winters M A, Crompton M, Loi M, Kundu S K, Davis M M, Merigan T C. Frequency of class I HLA-restricted anti-HIV CD8+ T cells in individuals receiving highly active antiretroviral therapy (HAART) J Immunol. 1999;162:1780–1788. - PubMed
- Kalams S A, Goulder P J, Shea A K, Jones N G, Trocha A K, Ogg G S, Walker B D. Levels of human immunodeficiency virus type 1-specific cytotoxic T-lymphocyte effector and memory responses decline after suppression of viremia with highly active antiretroviral therapy. J Virol. 1999;73:6721–6728. - PMC - PubMed
Publication types
MeSH terms
Substances
Grants and funding
- R37 AI035522/AI/NIAID NIH HHS/United States
- R37 AI35522/AI/NIAID NIH HHS/United States
- U01 AI043638/AI/NIAID NIH HHS/United States
- R01 AI47603/AI/NIAID NIH HHS/United States
- U01 AI43638/AI/NIAID NIH HHS/United States
LinkOut - more resources
Full Text Sources
Other Literature Sources
Medical
Research Materials


