Application of denaturing gradient gel electrophoresis (DGGE) to study the diversity of marine picoeukaryotic assemblages and comparison of DGGE with other molecular techniques - PubMed (original) (raw)
Application of denaturing gradient gel electrophoresis (DGGE) to study the diversity of marine picoeukaryotic assemblages and comparison of DGGE with other molecular techniques
B Díez et al. Appl Environ Microbiol. 2001 Jul.
Abstract
We used denaturing gradient gel electrophoresis (DGGE) to study the diversity of picoeukaryotes in natural marine assemblages. Two eukaryote-specific primer sets targeting different regions of the 18S rRNA gene were tested. Both primer sets gave a single band when used with algal cultures and complex fingerprints when used with natural assemblages. The reproducibility of the fingerprints was estimated by quantifying the intensities of the same bands obtained in independent PCR and DGGE analyses, and the standard error of these estimates was less than 2% on average. DGGE fingerprints were then used to compare the picoeukaryotic diversity in samples obtained at different depths and on different dates from a station in the southwest Mediterranean Sea. Both primer sets revealed significant differences along the vertical profile, whereas temporal differences at the same depths were less marked. The phylogenetic composition of picoeukaryotes from one surface sample was investigated by excising and sequencing DGGE bands. The results were compared with an analysis of a clone library and a terminal restriction fragment length polymorphism fingerprint obtained from the same sample. The three PCR-based methods, performed with three different primer sets, revealed very similar assemblage compositions; the same main phylogenetic groups were present at similar relative levels. Thus, the prasinophyte group appeared to be the most abundant group in the surface Mediterranean samples as determined by our molecular analyses. DGGE bands corresponding to prasinophytes were always found in surface samples but were not present in deep samples. Other groups detected were prymnesiophytes, novel stramenopiles (distantly related to hyphochytrids or labyrinthulids), cryptophytes, dinophytes, and pelagophytes. In conclusion, the DGGE method described here provided a reasonably detailed view of marine picoeukaryotic assemblages and allowed tentative phylogenetic identification of the dominant members.
Figures
FIG. 1
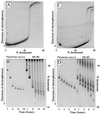
(A) Negative image of a perpendicular DGGE gel with PCR products obtained with primer set A from different algal cultures (P. calceolata, T. pseudonana, and P. suecica) and electrophoresed at 100 V for 16 h. (B) Time course separation of PCR products obtained with primer set A from an algal culture (P. suecica) and marine sample ME-B0. Samples were electrophoresed for 3, 5, 8, 11, 14, 16, and 18 h at 100 V. (C) Same as panel A but with PCR products amplified with primer set B. The electrophoresis conditions were 200 V for 6 h. (D) Same as panel B but with PCR products amplified with primer set B. Samples were electrophoresed for 2, 3, 4, 5, 6, 7, and 8 h at 200 V.
FIG. 2
DGGE fingerprints of algal cultures amplified with primer set A (A) and primer set B (B). The following cultures were tested: lane 1, P. calceolata; lane 2, N. oculata; lane 3, T. pseudonana; lane 4, D. primolecta; lane 5, P. suecica; lane 6, H. akashiwo; lane 7, Heterocapsa sp.
FIG. 3
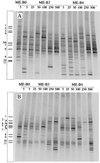
DGGE fingerprints of picoeukaryotic assemblages obtained at station ME-B (southwest Mediterranean Sea) at different times (ME-B0, 11 November 1997; ME-B3, 9 May 1998; ME-B4, 12 May 1998) and at different depths (5 to 500 m). The fingerprints were obtained with primer set A (A) and primer set B (B). Bands from sample ME-B0 that were sequenced are indicated on the left side of each gel.
FIG. 4
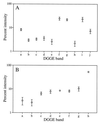
Averages and standard errors of intensity values for DGGE bands of sample ME-B0 as quantified from separate PCR and DGGE analyses with primer set A (A) (n = 5) and primer set B (B) (n = 4). Where error bars are not visible, the error was smaller than the symbol.
FIG. 5
NMDS diagrams relating the picoeukaryotic assemblages in ME-B samples on the basis of the DGGE gels shown in Fig. 3. NMDS diagrams were calculated from fingerprints obtained with primer set A using the intensity (A) and binary (C) matrices and from fingerprints obtained with primer set B using the intensity (B) and binary (D) matrices. On each diagram the grey circle corresponds to sample ME-B0, the solid circles correspond to ME-B3 samples, and the open circles correspond to ME-B4 samples. Solid and dashed lines join the data for the ME-B3 and ME-B4 samples, respectively, obtained from the surface (5 m) to a depth of 500 m. Only bands that accounted for at least 1% of the intensity in a lane were used in this analysis.
FIG. 6
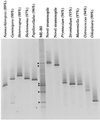
DGGE fingerprints obtained with primer set A for the ME-B0 sample and several clones from the genetic library obtained from the same sample. The clone names are the names of the most closely related organisms in the database (levels of similarity are given in parentheses) found in a BLAST search. The lanes to the right of the ME-B0 sample contained clones representing phylotypes that have been retrieved by sequencing DGGE bands (indicated by arrowheads).
Similar articles
- Study of genetic diversity of eukaryotic picoplankton in different oceanic regions by small-subunit rRNA gene cloning and sequencing.
Díez B, Pedrós-Alió C, Massana R. Díez B, et al. Appl Environ Microbiol. 2001 Jul;67(7):2932-41. doi: 10.1128/AEM.67.7.2932-2941.2001. Appl Environ Microbiol. 2001. PMID: 11425705 Free PMC article. - Genetic diversity of plankton community as depicted by PCR-DGGE fingerprinting and its relation to morphological composition and environmental factors in Lake Donghu.
Yan QY, Yu YH, Feng WS, Deng WN, Song XH. Yan QY, et al. Microb Ecol. 2007 Aug;54(2):290-7. doi: 10.1007/s00248-006-9200-3. Epub 2007 Jun 1. Microb Ecol. 2007. PMID: 17541768 - Genetic diversity of eukaryotic plankton assemblages in Eastern Tibetan Lakes differing by their salinity and altitude.
Wu QL, Chatzinotas A, Wang J, Boenigk J. Wu QL, et al. Microb Ecol. 2009 Oct;58(3):569-81. doi: 10.1007/s00248-009-9526-8. Epub 2009 May 16. Microb Ecol. 2009. PMID: 19444496 Free PMC article. - Molecular identification of nanoplanktonic protists based on small subunit ribosomal RNA gene sequences for ecological studies.
Lim EL. Lim EL. J Eukaryot Microbiol. 1996 Mar-Apr;43(2):101-6. doi: 10.1111/j.1550-7408.1996.tb04488.x. J Eukaryot Microbiol. 1996. PMID: 8720940 Review. - Application of denaturing gradient gel electrophoresis (DGGE) to the analysis of endodontic infections.
Siqueira JF Jr, Rôças IN, Rosado AS. Siqueira JF Jr, et al. J Endod. 2005 Nov;31(11):775-82. doi: 10.1097/01.don.0000155221.33667.bb. J Endod. 2005. PMID: 16249718 Review.
Cited by
- Microbial community composition of transiently wetted Antarctic Dry Valley soils.
Niederberger TD, Sohm JA, Gunderson TE, Parker AE, Tirindelli J, Capone DG, Carpenter EJ, Cary SC. Niederberger TD, et al. Front Microbiol. 2015 Jan 28;6:9. doi: 10.3389/fmicb.2015.00009. eCollection 2015. Front Microbiol. 2015. PMID: 25674080 Free PMC article. - Microbial community composition of Tirez lagoon (Spain), a highly sulfated athalassohaline environment.
Montoya L, Vizioli C, Rodríguez N, Rastoll MJ, Amils R, Marin I. Montoya L, et al. Aquat Biosyst. 2013 Oct 2;9(1):19. doi: 10.1186/2046-9063-9-19. Aquat Biosyst. 2013. PMID: 24083554 Free PMC article. - Planktonic eukaryotes in the Chesapeake Bay: contrasting responses of abundant and rare taxa to estuarine gradients.
Wang H, Liu F, Wang M, Bettarel Y, Eissler Y, Chen F, Kan J. Wang H, et al. Microbiol Spectr. 2024 May 2;12(5):e0404823. doi: 10.1128/spectrum.04048-23. Epub 2024 Apr 12. Microbiol Spectr. 2024. PMID: 38606959 Free PMC article. - Unveiling trophic functions of uncultured protist taxa by incubation experiments in the brackish Baltic Sea.
Weber F, del Campo J, Wylezich C, Massana R, Jürgens K. Weber F, et al. PLoS One. 2012;7(7):e41970. doi: 10.1371/journal.pone.0041970. Epub 2012 Jul 30. PLoS One. 2012. PMID: 22860041 Free PMC article. - First record of picophytoplankton diversity in Central European hypersaline lakes.
Keresztes ZG, Felföldi T, Somogyi B, Székely G, Dragoş N, Márialigeti K, Bartha C, Vörös L. Keresztes ZG, et al. Extremophiles. 2012 Sep;16(5):759-69. doi: 10.1007/s00792-012-0472-x. Epub 2012 Aug 10. Extremophiles. 2012. PMID: 22878729
References
- Andersen R A, Saunders G W, Paskind M P, Sexton J P. Ultrastructure and 18S rRNA gene sequence for Pelagomonas calceolata gen. et sp. nov. and the description of a new algal class, the Pelagophyceae classis nov. J Phycol. 1993;29:701–715.
- Andersen R A, Bidigare R R, Keller M D, Latasa M. A comparison of HPLC pigment signatures and electron microscopic observations for oligotrophic waters of the North Atlantic and Pacific oceans. Deep-Sea Res II. 1996;43:517–537.
Publication types
MeSH terms
Substances
LinkOut - more resources
Full Text Sources
Other Literature Sources


