Kinetics of core histones in living human cells: little exchange of H3 and H4 and some rapid exchange of H2B - PubMed (original) (raw)
Kinetics of core histones in living human cells: little exchange of H3 and H4 and some rapid exchange of H2B
H Kimura et al. J Cell Biol. 2001.
Abstract
Histones H2A and H2B form part of the same nucleosomal structure as H3 and H4. Stable HeLa cell lines expressing histones H2B, H3, and H4 tagged with green fluorescent protein (GFP) were established; the tagged molecules were assembled into nucleosomes. Although H2B-GFP was distributed like DNA, H3-GFP and H4-GFP were concentrated in euchromatin during interphase and in R-bands in mitotic chromosomes. These differences probably result from an unregulated production of tagged histones and differences in exchange. In both single cells and heterokaryons, photobleaching revealed that H2B-GFP exchanged more rapidly than H3-GFP and H4-GFP. About 3% of H2B exchanged within minutes, whereas approximately 40% did so slowly (t(1/2) approximately 130 min). The rapidly exchanging fraction disappeared in 5,6-dichloro-1-beta-d-ribofuranosylbenzimidazole and so may represent H2B in transcriptionally active chromatin. The slowly exchanging fraction was probably associated with chromatin domains surrounding active units. H3-GFP and H4-GFP were assembled into chromatin when DNA was replicated, and then >80% remained bound permanently. These results reveal that the inner core of the nucleosome is very stable, whereas H2B on the surface of active nucleosomes exchanges continually.
Figures
Figure 1
GFP-tagged histones in HeLa cells imaged by confocal and conventional microscopy. (A, G, and N) Single optical sections show H2B-GFP is more concentrated in heterochromatin than H3-GFP and H4-GFP. (Insets) High power views. (B–D, H–J, and O–Q) In each case, three views of the same field of live cells stained with Hoechst 33342 are shown (GFP and Hoechst are green and red in merges). (E–F, K–L, and R–S) Metaphase spreads were prepared, DNA was stained with Hoechst, and two views of the same field were collected. (Inset) Chromosome 1 (merge in middle). Bars, 10 μm.
Figure 2
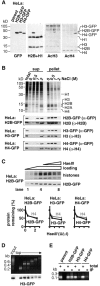
GFP-tagged histones behave like their endogenous counterparts. (A) Expression and acetylation. GFP, H2B, acetylated H3, and acetylated H4 are detected in immunoblots of the total proteins in parental cells and the three clones. Band intensities do not directly reflect expression levels because differences in charge and size affect transfer during blotting; thus, the H2B-GFP band in the second lane is more intense than the H2B band because it is transferred more efficiently and not because its expression level is higher (see also Kanda et al. 1998). (B) Solubility in NaCl. Cells were lysed in PB plus 0.1% Triton X-100 and 0–2 M NaCl and pelleted. Proteins from whole cells (total), the supernatant (sup), and pellet were resolved in gels and stained with Coomassie blue (top panel shows line expressing H2B-GFP) or blotted and probed with the antibodies indicated on the right (cell line shown on the left). (C) Sensitivity to HaeIII. (Top panel) Cells expressing H2B-GFP were lysed, incubated with or without HaeIII, and pelleted; then, proteins in the pellet were resolved by electrophoresis, stained with Coomassie (top), or immunoblotted using anti-GFP (bottom). (Lanes 1–4) All without HaeIII (loadings of 1/8×, 1/4×, 1/2×, and 1×, respectively). (Lanes 5–8) Treated with 0, 0.1, 0.5, or 2.5 U/μl HaeIII (all loadings 1×). (Bottom panels) The amounts of H4 and tagged histones remaining in pellets from the three clones after nuclease treatment and pelleting (from band intensities in stained gels and blots). (D) Cosedimentation with nucleosomal “ladder.” Cells expressing H3-GFP were permeabilized, incubated with HaeIII, and pelleted; after spinning released chromatin fragments in the supernatant through a glycerol gradient, DNA and proteins in the different fractions were analyzed by gel electrophoresis (“input” refers to material applied to the gradient). (Top) Nucleosomal “ladders” revealed after staining DNA with ethidium. (Bottom) H3-GFP detected by immunoblotting using anti-GFP; it is present in all fractions except the topmost. (E) Immunoprecipitation with DNA. Nucleosome core particles were prepared using micrococcal nuclease from four lines and immunoprecipitated using anti-GFP. Then, DNA in the starting material (total; 1/5× loading) and immunoprecipitated pellet (IP) was resolved by electrophoresis and stained with ethidium; core DNA fragments are immunoprecipitated from all lines except the parent.
Figure 3
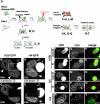
Different behavior of histone-GFPs in heterokaryons. (A) Assays. Donor cells expressing histone-GFP are fused with recipient HeLa; the recipient nucleus in the resulting heterokaryon gains histone-GFP. (A, left, B–E) A rectangular area is photobleached. If histone-GFP is mobile, molecules from outside repopulate the bleached area, reducing fluorescence throughout nuclei; if immobile, the bleached area persists. (A, right, F–T) Heterokaryons are loaded with Cy3-dUTP, and any S phase nuclei incorporate Cy3-dUTP into characteristic foci. Heterokaryons may then pass through mitosis, and chromosomes originally from different nuclei segregate and assemble into chimeric daughter nuclei. The stages when confocal images are collected are indicated. (B and C) 5:45 h after fusion, this trikaryon contains one bright donor (arrow) and two recipients that have gained H2B-GFP (arrowheads). Now, the rectangular area is bleached. Approximately 1 min later, the bleached area in all three nuclei still persists, showing that H2B-GFP is immobile over this time scale. (D and E) 5:33 h after fusion, this trikaryon contains one bright donor (arrow), one recipient with some H4-GFP distributed in a pattern reminiscent of late-replicating DNA (filled arrowhead), and one recipient with diffusely spread H4-GFP (open arrowhead). After bleaching, most fluorescence is lost from the latter, showing that the H4-GFP within it is mobile. In contrast, bleached areas in the other two persist, indicating that their H4-GFP is immobile. (F–H) Tetrakaryon with one donor and three recipients; Cy3 labeling shows that no nuclei are in S phase, and all recipients possess diffuse distributions of H2B-GFP. (I–K) Trikaryon with two donors and one recipient. The recipient has a Cy3 pattern characteristic of mid–S phase. Some H2B-GFP is distributed diffusely, and some is concentrated in replication foci (yellow in the merge). (L–N) Dikaryon. Only the donor is labeled with Cy3 and so was in S phase; H3-GFP is spread homogeneously throughout the nucleoplasm in the non–S phase recipient. (O–Q) Tetrakaryon with one donor and three recipients. All recipients incorporated Cy3 into a mid–S phase pattern, and H3-GFP is distributed similarly; this suggests that the two were incorporated together. (R–T) Chimeric nucleus containing H4-GFP concentrated at the bottom derived from donor chromosomes and Cy3 at the top derived from recipients. The perinucleolar H4-GFP foci originally in the recipient retain their characteristic organization through mitosis, showing that some H4-GFP remains bound stably. Bars, 10 μm.
Figure 4
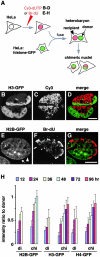
Slow equilibration of histone-GFP in chimeric nuclei. (A) Assays. HeLa cells were labeled with Cy3-dUTP or BrdU, fused with cells expressing histone-GFP, and the resulting heterokaryons were allowed to pass through mitosis so that chromosomes from different nuclei assembled into one chimeric daughter. Recipient chromosomes are identified in living cells or indirectly by immunolabeling fixed cells. (B–D) HeLa cells were loaded with Cy3-dUTP, grown for 20 h, fused with cells expressing H3-GFP, and regrown for ∼16 h. Three views of one confocal section through two living chimeric daughters are shown; H3-GFP in each daughter is concentrated in one part, and Cy3-DNA is concentrated in the other. (E–G) HeLa cells were grown in BrdU for 24 h, fused, fixed 36 h later, Br-DNA immunolabeled, and three views of one confocal section of a chimeric nucleus were collected. H2B-GFP remains concentrated in donor heterochromatin (arrow), but has not yet equilibrated with recipient heterochromatin (arrowhead). (H) The intensity of histone-GFP autofluorescence in recipient regions (containing Br-DNA) relative to that in donor regions (lacking Br-DNA) was measured using images of chimeric nuclei (chi; n > 29) like those in E–G and of nuclei in dikaryons (di; n > 19) in the same population. Bars, 10 μm.
Figure 5
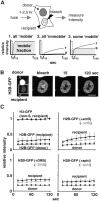
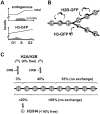
Soluble pools measured using FRAP. (A) Strategy and different scenarios illustrating how the mobile fraction affects recovery (as described in Results). (B) 2:26 h after fusion, images were collected shortly before and after bleaching part of a recipient nucleus in a dikaryon. (C) Relative intensities (± SDs; n = 10–16) of bleached areas. In some cases, actD (5 μg/ml), DRB (100 nM), or aphidicolin (aphi; 5 μg/ml) was added 1 h before fusion. Results for H2B-GFP in S phase and non–S phase nuclei are pooled, since they differed little. Curves for H2B-GFP without inhibitor (left, top and bottom) are presented in the other panels in grey.
Figure 6
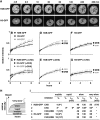
Different kinetic populations of histone-GFPs revealed by FRAP. (A) A small area within the nucleus of a cell expressing histone-GFP was bleached, and confocal images were collected every 10 min for 1 h and every 30 min thereafter. Typical images are shown. (B–G) Relative intensities (± SD; n = 9–22) within bleached areas were measured using images like those in A. In some cases, 20 μg/ml cycloheximide (CHX; C, E, and G) or 100 nM DRB (D–G) was added 30–60 min before bleaching. Grey lines (con) in D–G are reproduced from those in B and C. (H) Interpretation. The intensity is reduced by bleaching to a “baseline” (determined using fixed cells), and it then recovers as unbleached molecules enter. The rate and extent of recovery depend on the contribution of different kinetic fractions. Here, a “mobile” fraction diffuses in before the first image can be collected after bleaching. Then, a “rapid” fraction is initially dominant before a “slow” fraction becomes progressively more important; a “very slow” fraction enters too slowly to be monitored during the experiment. (I) Percentage of the population and association t 1/2 of different fractions (determined using data from C, E, and G). The percentage of the “mobile” fraction was generally increased in CHX so the value without CHX is also shown in brackets (a). With H2B-GFP in CHX (row 2), the curve was best fitted assuming there was also a “rapid” population (b).
Figure 7
Models for histone exchange. (A) Changes in histone levels during the cell cycle. Endogenous histones are made mainly during S phase when a soluble pool is seen. Tagged histones are made continuously; the soluble pool that accumulates by the end of G1 phase is depleted in S phase (as histones are incorporated) and then replenished in G2 phase. (B) Incorporation of tagged histones (black areas) into chromatin. Nucleosomes are represented as circles with eight sectors, DNA as a forked line. H2B-GFP exchanges with H2B before, during (not shown), and after replication. H3-GFP is mainly incorporated into nucleosome cores near the replication fork; subsequently, it does not exchange. (C) Different kinetic populations. H2B is found in four populations: 4% diffuses freely, 3% in active transcription units exchanges rapidly (t 1/2 ∼ 6 min), 40% in the surrounding domains exchanges slowly (t 1/2 ∼ 130 min), and 53% in heterochromatin is essentially immobile (t 1/2 > 510 min). Although H2A was not studied, it is assumed to behave like H2B. H3 is found in three populations: <16% diffuses freely, <16% in and around active transcription units exchanges slowly (_t_ 1/2 ∼ 130 min), and >68% is essentially immobile (this constitutes >80% of the incorporated fraction). H4 behaved similarly to H3. The diffusing and slowly exchanging fractions of H3-GFP and H4-GFP are overestimated because expression of the tagged histones is unregulated. DRB affects exchange as indicated.
Similar articles
- Association of nucleosome core particle DNA with different histone oligomers. Transfer of histones between DNA-(H2A,H2B) and DNA-(H3,H4) complexes.
Aragay AM, Diaz P, Daban JR. Aragay AM, et al. J Mol Biol. 1988 Nov 5;204(1):141-54. doi: 10.1016/0022-2836(88)90605-5. J Mol Biol. 1988. PMID: 3216389 - A novel histone exchange factor, protein phosphatase 2Cgamma, mediates the exchange and dephosphorylation of H2A-H2B.
Kimura H, Takizawa N, Allemand E, Hori T, Iborra FJ, Nozaki N, Muraki M, Hagiwara M, Krainer AR, Fukagawa T, Okawa K. Kimura H, et al. J Cell Biol. 2006 Nov 6;175(3):389-400. doi: 10.1083/jcb.200608001. Epub 2006 Oct 30. J Cell Biol. 2006. PMID: 17074886 Free PMC article. - Histone dynamics in living cells revealed by photobleaching.
Kimura H. Kimura H. DNA Repair (Amst). 2005 Jul 28;4(8):939-50. doi: 10.1016/j.dnarep.2005.04.012. DNA Repair (Amst). 2005. PMID: 15905138 Review. - All roads lead to chromatin: multiple pathways for histone deposition.
Li Q, Burgess R, Zhang Z. Li Q, et al. Biochim Biophys Acta. 2013 Mar-Apr;1819(3-4):238-46. Biochim Biophys Acta. 2013. PMID: 24459726 Review.
Cited by
- Cell differentiation and development in Arabidopsis are associated with changes in histone dynamics at the single-cell level.
Rosa S, Ntoukakis V, Ohmido N, Pendle A, Abranches R, Shaw P. Rosa S, et al. Plant Cell. 2014 Dec;26(12):4821-33. doi: 10.1105/tpc.114.133793. Epub 2014 Dec 30. Plant Cell. 2014. PMID: 25549670 Free PMC article. - Interactions With Histone H3 & Tools to Study Them.
Scott WA, Campos EI. Scott WA, et al. Front Cell Dev Biol. 2020 Jul 31;8:701. doi: 10.3389/fcell.2020.00701. eCollection 2020. Front Cell Dev Biol. 2020. PMID: 32850821 Free PMC article. Review. - Histone acetyltransferase 1 promotes homologous recombination in DNA repair by facilitating histone turnover.
Yang X, Li L, Liang J, Shi L, Yang J, Yi X, Zhang D, Han X, Yu N, Shang Y. Yang X, et al. J Biol Chem. 2013 Jun 21;288(25):18271-82. doi: 10.1074/jbc.M113.473199. Epub 2013 May 7. J Biol Chem. 2013. PMID: 23653357 Free PMC article. - bHLH transcription factors cooperate with chromatin remodelers to regulate cell fate decisions during Arabidopsis stomatal development.
Liu A, Mair A, Matos JL, Vollbrecht M, Xu SL, Bergmann DC. Liu A, et al. PLoS Biol. 2024 Aug 16;22(8):e3002770. doi: 10.1371/journal.pbio.3002770. eCollection 2024 Aug. PLoS Biol. 2024. PMID: 39150946 Free PMC article. - RNA polymerase complexes cooperate to relieve the nucleosomal barrier and evict histones.
Kulaeva OI, Hsieh FK, Studitsky VM. Kulaeva OI, et al. Proc Natl Acad Sci U S A. 2010 Jun 22;107(25):11325-30. doi: 10.1073/pnas.1001148107. Epub 2010 Jun 7. Proc Natl Acad Sci U S A. 2010. PMID: 20534568 Free PMC article.
References
- Bednar J., Studitsky V.M., Grigoryev S.A., Felsenfeld G., Woodcock C.L. The nature of the nucleosomal barrier to transcriptiondirect observation of paused intermediates by electron cryomicroscopy. Mol. Cell. 1999;4:377–386. - PubMed
- Bell A.C., Felsenfeld G. Stopped at the borderboundaries and insulators. Curr. Opin. Genet. Dev. 1999;9:191–198. - PubMed
- Belmont A.S., Dietzel S., Nye A.C., Strukov Y.G., Tumbar T. Large-scale chromatin structure and function. Curr. Opin. Cell Biol. 1999;11:307–311. - PubMed
- Bonner W.M., Wu R.S., Panusz H.T., Muneses C. Kinetics of accumulation and depletion of soluble newly synthesized histone in the reciprocal regulation of histone and DNA synthesis. Biochemistry. 1988;27:6542–6550. - PubMed
Publication types
MeSH terms
Substances
LinkOut - more resources
Full Text Sources
Other Literature Sources

