Programmed cell death of developing mammalian neurons after genetic deletion of caspases - PubMed (original) (raw)
Programmed cell death of developing mammalian neurons after genetic deletion of caspases
R W Oppenheim et al. J Neurosci. 2001.
Abstract
An analysis of programmed cell death of several populations of developing postmitotic neurons after genetic deletion of two key members of the caspase family of pro-apoptotic proteases, caspase-3 and caspase-9, indicates that normal neuronal loss occurs. Although the amount of cell death is not altered, the death process may be delayed, and the cells appear to use a nonapoptotic pathway of degeneration. The neuronal populations examined include spinal interneurons and motor, sensory, and autonomic neurons. When examined at both the light and electron microscopic levels, the caspase-deficient neurons exhibit a nonapoptotic morphology in which nuclear changes such as chromatin condensation are absent or reduced; in addition, this morphology is characterized by extensive cytoplasmic vacuolization that is rarely observed in degenerating control neurons. There is also reduced terminal deoxynucleotidyl transferase-mediated biotinylated UTP nick end labeling in dying caspase-deficient neurons. Despite the altered morphology and apparent temporal delay in cell death, the number of neurons that are ultimately lost is indistinguishable from that seen in control animals. In contrast to the striking perturbations in the morphology of the forebrain of caspase-deficient embryos, the spinal cord and brainstem appear normal. These results are consistent with the growing idea that the involvement of specific caspases and the occurrence of caspase-independent programmed cell death may be dependent on brain region, cell type, age, and species or may be the result of specific perturbations or pathology.
Figures
Fig. 1.
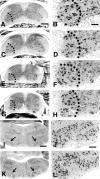
The spinal cord and brainstem of caspase-3-deficient mice appear morphologically normal. Nissl-stained transverse sections of postnatal day 10 (P10) mouse spinal cord (A–H) and brainstem–facial motor nucleus (I–L) of caspase-3-deficient (A, B, E, F, I, J) and control animals (C, D, G, H, K, L) are shown. A–D, Brachial;E–H, lumbar; I–L, brainstem–facial nucleus. Scale bars: A, C, E, G, 300 μm (shown in_A_); B, D, F, H, 50 μm (shown in_B_); I, K, 250 μm (shown in_I_); J, L, 120 μm (shown in_J_). Dotted lines indicate ventral horns; an arrow indicates the facial motor nucleus.
Fig. 2.
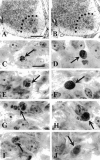
Nissl-stained transverse sections of E16.5 lumbar spinal cord of homozygous littermate control (+/+) (A) and caspase-9-deficient −/− (B) embryos. Dotted lines in_A_ and B indicate the medial border of the ventral horn. Scale bar, 100 μm. C, E, G, I, Degenerating neurons (arrows) from E14.5 caspase-3 (C, E) and caspase-9 (G, I) control (+/+) embryos. Note fragmented apoptotic bodies in_G_ and I. Scale bar, 10 μm. D, F, H, J, Degenerating neurons (arrows) from caspase-3-deficient (D, F) and caspase-9-deficient (H, J) (−/−) embryos. Note the lack of prominent pyknosis and apoptotic bodies and the increased cytoplasmic density (compare G and_H_) in caspase-deficient dying neurons.Asterisks indicate normal non-dying cells.
Fig. 3.
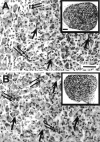
Transverse sections through the middle of the superior cervical ganglion (SCG) of homozygote (A) and caspase-3 KO (B) littermates at P8. The overall size and organization of the ganglia appear normal in both low-magnification (insets) and high-magnification photomicrographs from KO animals.Arrows indicate some of the SCG neurons; double arrows indicate non-neuronal cells. Scale bars: A, B at full size, 25 μm; insets, 40 μm.
Fig. 4.
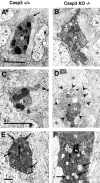
Photomicrographs of degenerating spinal cord neurons from E14.5 caspase-3 (Casp3) +/+ (A, C, E) and caspase-3 (Casp3) KO −/− (B, D, F) littermate embryos showing the distinct morphology of dying neurons in the caspase KO. These cells exhibit reduced chromatin condensation and nuclear pyknosis, marked cytoplasmic vacuolization, and dilation of mitochondria and RER compared with neurons from the caspase-3 +/+ embryos. C, Cytoplasm/soma;N, nuclei. Asterisks indicate normal non-dying neurons. The arrow in A_indicates the cytoplasm, the arrows in E_and F indicate mitochondria, and the_arrowheads in D indicate the cell boundary of this degenerating motoneuron. Note the numerous vacuoles and abnormal organelles in the cytoplasm of the cells in_D and F. Only part of the cytoplasm of a dying cell is shown in E. The scale bars in_A_, C, and E are the same for B, D, and F, respectively.
Fig. 5.
The number (mean ± SD) of degenerating MNs in the lumbar spinal cord of control +/+ (CON), caspase-3 −/− (Casp3− /−), and caspase-9 −/− (Casp9− /−) embryos on E14.5 and E16.5 expressed as the number per 1000 surviving MNs. The sample size (number of embryos) is indicated in the_bars_. In all groups, there was a significant (p < 0.01) reduction between E14.5 and E16.5.
Fig. 6.
Caspase-3 immunocytochemistry (A, B), TUNEL (C, E), and bisbenzimide staining (D, F) in E14.5 wild-type (A, C, D) and caspase-3 KO (B, E, F) lumbar spinal cord. A, Immunocytochemistry shows the staining of a cleaved (activated) caspase-3 subunit in the spinal motor neuron column and spinal ganglia in E14.5 wild-type mouse spinal cord (arrowheads), indicating the activation of caspase-3. B, In contrast, no staining of activated caspase-3 subunit is found in E14.5 caspase-3-deficient spinal cord. However, when the TUNEL method is used to detect cell death (C, E), it reveals positive staining in both wild-type (C) and caspase-3-deficient (E) spinal cord, although the staining patterns are distinct. The TUNEL-positive profiles in C and_E_ represent the nucleus of an individual neuron. In wild-type spinal cord, there are more TUNEL-positive nuclei showing punctuate nuclear staining (C), which is correlated with condensed chromatin as revealed by bisbenzimide staining (D). In contrast, there are fewer TUNEL-positive cells in caspase-3-deficient spinal cord (see Results). Moreover, these cells typically show a distinct kind of TUNEL staining (E) and no clear evidence of chromatin condensation as indicated by the size of TUNEL-positive nuclei and reduced bisbenzimide-stained chromatin (F). Although not obvious in this photomicrograph, the nucleus indicated by the arrow in_F_ is weakly labeled with bisbenzimide, indicating little, if any, chromatin condensation. Scale bars: A, B, 400 μm; C–F, 20 μm.
Similar articles
- Bcl-X(L)-caspase-9 interactions in the developing nervous system: evidence for multiple death pathways.
Zaidi AU, D'Sa-Eipper C, Brenner J, Kuida K, Zheng TS, Flavell RA, Rakic P, Roth KA. Zaidi AU, et al. J Neurosci. 2001 Jan 1;21(1):169-75. doi: 10.1523/JNEUROSCI.21-01-00169.2001. J Neurosci. 2001. PMID: 11150333 Free PMC article. - Region of caspase-3 activation and programmed cell death in the early development of the mouse forebrain.
Urase K, Kouroku Y, Fujita E, Momoi T. Urase K, et al. Brain Res Dev Brain Res. 2003 Nov 12;145(2):241-8. doi: 10.1016/j.devbrainres.2003.07.002. Brain Res Dev Brain Res. 2003. PMID: 14604764 - Roles of caspases in the programmed cell death of motoneurons in vivo.
Yaginuma H, Sato N, Homma S, Oppenheim RW. Yaginuma H, et al. Arch Histol Cytol. 2001 Dec;64(5):461-74. doi: 10.1679/aohc.64.461. Arch Histol Cytol. 2001. PMID: 11838706 Review. - Strain-specific caspase-3-dependent programmed cell death in the early developing mouse forebrain.
Momoi T, Fujita E, Urase K. Momoi T, et al. Neuroreport. 2003 Jan 20;14(1):111-5. doi: 10.1097/00001756-200301200-00021. Neuroreport. 2003. PMID: 12544841 - Apoptosis and brain development.
Roth KA, D'Sa C. Roth KA, et al. Ment Retard Dev Disabil Res Rev. 2001;7(4):261-6. doi: 10.1002/mrdd.1036. Ment Retard Dev Disabil Res Rev. 2001. PMID: 11754520 Review.
Cited by
- The genomically mosaic brain: aneuploidy and more in neural diversity and disease.
Bushman DM, Chun J. Bushman DM, et al. Semin Cell Dev Biol. 2013 Apr;24(4):357-69. doi: 10.1016/j.semcdb.2013.02.003. Epub 2013 Mar 4. Semin Cell Dev Biol. 2013. PMID: 23466288 Free PMC article. Review. - The wobbler mouse: a neurodegeneration jigsaw puzzle.
Boillée S, Peschanski M, Junier MP. Boillée S, et al. Mol Neurobiol. 2003 Aug;28(1):65-106. doi: 10.1385/MN:28:1:65. Mol Neurobiol. 2003. PMID: 14514986 Review. - Human brain development through the lens of cerebral organoid models.
Andrews MG, Nowakowski TJ. Andrews MG, et al. Brain Res. 2019 Dec 15;1725:146470. doi: 10.1016/j.brainres.2019.146470. Epub 2019 Sep 19. Brain Res. 2019. PMID: 31542572 Free PMC article. Review. - Developing postmitotic mammalian neurons in vivo lacking Apaf-1 undergo programmed cell death by a caspase-independent, nonapoptotic pathway involving autophagy.
Oppenheim RW, Blomgren K, Ethell DW, Koike M, Komatsu M, Prevette D, Roth KA, Uchiyama Y, Vinsant S, Zhu C. Oppenheim RW, et al. J Neurosci. 2008 Feb 6;28(6):1490-7. doi: 10.1523/JNEUROSCI.4575-07.2008. J Neurosci. 2008. PMID: 18256270 Free PMC article. - Caspase-independent programmed cell death triggers Ca2PO4 deposition in an in vitro model of nephrocalcinosis.
Priante G, Quaggio F, Gianesello L, Ceol M, Cristofaro R, Terrin L, Furlan C, Del Prete D, Anglani F. Priante G, et al. Biosci Rep. 2018 Jan 17;38(1):BSR20171228. doi: 10.1042/BSR20171228. Print 2018 Feb 28. Biosci Rep. 2018. PMID: 29208768 Free PMC article.
References
- Agerman K, Baudet C, Fundin B, Willson C, Ernfors P. Attenuation of a caspase-3-dependent cell death in NT-4 and p75-deficient embryonic sensory neurons. Mol Cell Neurosci. 2000;16:258–268. - PubMed
- Bortner CD, Cidlowski JA. Caspase-independent/dependent regulation of K+, cell shrinkage, and mitochondrial membrane potential during lymphocyte apoptosis. J Biol Chem. 1999;274:21953–21962. - PubMed
- Cecconi F, Alvarez-Bolado G, Meyer BI, Roth KA, Gruss P. Apaf1 (CED-4 homolog) regulates programmed cell death in mammalian development. Cell. 1998;94:727–737. - PubMed
- Chautan M, Chazal G, Cecconi F, Gruss P, Golstein P. Interdigital cell death can occur through a necrotic and caspase-independent pathway. Curr Biol. 1999;9:967–970. - PubMed
- Chu-Wang IW, Oppenheim RW. Cell death of motoneurons in the chick embryo spinal cord. J Comp Neurol. 1978;177:59–86. - PubMed
Publication types
MeSH terms
Substances
LinkOut - more resources
Full Text Sources
Other Literature Sources
Molecular Biology Databases
Research Materials


