Perceptually bistable three-dimensional figures evoke high choice probabilities in cortical area MT - PubMed (original) (raw)
Perceptually bistable three-dimensional figures evoke high choice probabilities in cortical area MT
J V Dodd et al. J Neurosci. 2001.
Abstract
The role of the primate middle temporal area (MT) in depth perception was examined by considering the trial-to-trial correlations between neuronal activity and reported depth sensations. A set of moving random dots portrayed a cylinder rotating about its principal axis. In this structure-from-motion stimulus, the direction of rotation is ambiguous and the resulting percept undergoes spontaneous fluctuations. The stimulus can be rendered unambiguous by the addition of binocular disparities. We trained monkeys to report the direction of rotation in a set of these stimuli, one of which had zero disparity. Many disparity-selective neurons in area MT are selective for the direction of rotation defined by disparity. Across repeated presentations of the ambiguous (zero-disparity) stimulus, there was a correlation between neuronal firing and the reported direction of rotation, as found by Bradley et al. (1998). Quantification of this effect using choice probabilities (Britten et al., 1996) allowed us to demonstrate that the correlation cannot be explained by eye movements, behavioral biases, or attention to spatial location. MT neurons therefore appear to be involved in the perceptual decision process. The mean choice probability (0.67) was substantially larger than that reported for MT neurons in a direction discrimination task (Britten et al., 1996). This implies that MT neurons make a different contribution to the two tasks. For the depth task, either the pool of neurons used is smaller or the correlation between neurons in the pool is larger.
Figures
Fig. 1.
The cylinder stimulus consists of two oppositely moving transparent surfaces made up of random dots. At zero disparity, the dots are all imaged at the fixation plane. The velocity of the dots is a sinusoidal function of spatial position, which gives rise to a sensation of depth-from-motion. Because no depth order is specified, the direction of rotation of the cylinder is ambiguous. Adding a binocular disparity to the dots removes this ambiguity. Disparities are scaled sinusoidally according to the position of each dot on the surface of the cylinder. Positive disparities place the rightward moving dots at crossed disparities and the leftward moving dots at uncrossed disparities. This was defined as CCW rotation. The depth order is reversed for negative disparities, which correspond to CW rotation.
Fig. 2.
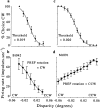
Examples of behavioral and neuronal responses obtained simultaneously. At the top (a, c), there are two psychometric functions, one from each monkey. The corresponding neuronal tuning functions obtained from the same set of trials are at the bottom (b, d). a and _b_show data from monkey Bi collected from a total of 191 trials.c and d show data from monkey Mr collected from a total of 470 trials. For the behavioral data, the percentage of choices in the CW direction is plotted as a function of added disparity, and the points are fitted with cumulative Gaussian curves. The threshold was taken as the SD of the fitted curve. Error bars show the SD of the binomial distribution. The neuronal data show the mean firing rate (error bars show the SD) over the 2 sec stimulus presentation plotted as a function of added disparity. The response of each neuron changes monotonically with added disparity. In b, the larger responses occur for negative disparities (CW rotation) as opposed to positive disparities (CCW rotation). Thus, the preferred (PREF) direction of rotation for this neuron was CW. The neuron whose data are illustrated in d showed the opposite preference (CCW).
Fig. 3.
Analysis of the trial-by-trial correlation between neuronal response and behavioral choice for the experiment illustrated in the left panels of Figure 2. The scatterplot in the middle shows the neuronal response plotted against trial number for each zero-disparity (ambiguous) trial. The_filled symbols_ represent the trials on which the monkey chose CW (PREF) rotation, and the open symbols represent those trials on which the monkey chose CCW (NULL) rotation. These data are summarized by the histograms on the left, which show the distribution of neuronal firing rates by choice. The separation of the two distributions can be quantified by the application of a signal detection theory to produce a measure of choice probability. The plot at the right shows, for a range of criterion response levels, the proportion of the PREF trials that exceeded the criterion (ordinate) against the proportion of NULL trials that exceeded the same criterion (abscissa). The area under this curve gives a nonparametric, criterion-free, measure of the separation of the distributions, the choice probability. For this example, the choice probability was 0.79; from the spike counts of this neuron alone, the probability of correctly predicting the animal's response on each zero-disparity trial is 0.79. This choice probability is significantly different from 0.5, which is the value that would be expected if the association between neuronal response and behavioral choice were random (permutation test; p < 0.05). CP, Choice probability.
Fig. 4.
Choice probabilities for two more neurons. For each experiment, the two smaller graphs on the_left_ show the psychophysical performance (top) and the neuronal responses (bottom) as functions of cylinder disparity; the scatterplot shows the trial-by-trial neuronal response for the subset of zero-disparity trials, labeled according to behavioral choice (filled, CW; open, CCW); the graphs on the right show the curve constructed for calculation of the choice probability. The neuron illustrated at the top (a) preferred CW rotation. Its choice probability was 0.66, close to the average for the whole population but not significantly different from 0.5. The neuron at the_bottom_ (b) also preferred CW rotation but had a choice probability close to that expected by chance. In this case, there appears to have been no link between variations in neuronal firing and the monkey's perceptual choice.
Fig. 5.
Distribution of choice probabilities. This histogram of choice probabilities summarizes the results from 93 MT neurons, all of which were selective for the disparity-defined direction of rotation of the cylinder stimulus. The mean choice probability was 0.67, with a range of 0.35–0.98. Filled bars delineate the neurons with a choice probability significantly different from 0.5 (40 of 93 neurons; permutation test;p < 0.05). Every choice probability that is statistically significant is >0.5 (i.e., the correlation is in accordance with the stimulus preference of the neuron for direction of rotation).
Fig. 6.
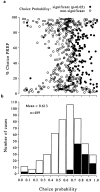
Choice probability across all stimulus disparity conditions for which the monkey made at least one mistake (n = 489). The scatterplot at the_top_ (a) shows the choice probability on the abscissa and the percentage of choices made in the preferred direction of each neuron on the ordinate. The jagged line indicates the running mean of 20 adjacent values of choice probability. The data are summarized in the histogram at the bottom(b). The mean of the distribution was 0.613. In_a_, the choices were mostly of one type at the extremes, so this produces less reliable and more scattered estimates of choice probability, which biases the mean choice probability toward 0.5 in these regions. If the analysis of mean choice probability is restricted to conditions for which the animals' choices contained at least 20% of each type of response, then the mean choice probability was 0.643, close to the value obtained for zero-disparity trials. The_filled_ symbols in a and the filled histogram bars in b show choice probability values that were significantly different from 0.5 (103 of 489 cases; permutation test; p < 0.05). A total of 98 of these 103 significant choice probabilities were >0.5, and only 5 of 103 were <0.5.
Fig. 7.
Difference of mean vergence angle between the two choices (CW minus CCW) plotted against choice probability. These data are for the zero-disparity condition only. _Filled symbols_show vergence differences that were found to be significant (t test; p < 0.05). Positive values indicate that the mean vergence position was more divergent on CW compared with CCW choice trials. Vergence data were unavailable for 12 of the experiments involving Bi (therefore, n = 28 for this animal). For animal Mr (left), the difference in mean vergence angle for CW and CCW choices was close to zero in the majority of experiments. Only animal Bi (right) showed differences in vergence behavior for the two choices. However, no correlation was observed between vergence behavior and choice probability for either animal.
Fig. 8.
Possible effect of a vergence behavior that is associated with behavioral choice. The arrows indicate both the disparity and direction preferences of two hypothetical neurons.Left, A neuron preferring motion to the left and near disparities, hence preferring CW rotation. Right, A neuron preferring motion to the right and near disparities, hence preferring CCW rotation. The middle of the figure describes a vergence behavior associated with behavioral choice for zero-disparity trials. In this example, the animal diverges before CW choices and converges before CCW choices (the behavior exhibited by monkey Bi). Therefore, the stimulus is placed at near disparities on trials when a CW choice is made, increasing the firing rate of both neurons. For the neuron plotted at the left, this increase is associated with choices in the preferred direction of the neuron. Hence, the vergence movement leads to a choice probability of >0.5. For the neuron plotted at the right, which prefers CCW rotation, this increase in firing for CW choices leads to a choice probability of <0.5.CP, Choice probability.
Fig. 9.
Distribution of choice probability according to the preferred direction of motion, shown separately for each monkey.Filled bars indicate neurons that preferred motion to the_left; open bars_ indicate neurons that preferred motion to the right. For monkey Bi, the mean values of choice probabilities were 0.648 ± 0.122 (±1 SD; n = 16) for neurons preferring leftward movement and 0.696 ± 0.135 (±1 SD; n = 24) for neurons preferring rightward movement. For monkey Mr, the mean values of choice probabilities were 0.684 ± 0.129 (±1 SD; n = 30) for neurons preferring leftward movement and 0.632 ± 0.148 (±1 SD; n = 23) for neurons preferring rightward movement. There was no significant difference between the distribution of choice probability values between the two motion preferences or between monkeys (χ2test; p > 0.05). Thus, the choice probabilities measured in monkey Bi cannot be explained simply by its vergence behavior.
Fig. 10.
Time course of the vergence movements made by monkey Bi in zero-disparity trials. The dotted and_dashed lines_ show the averages for trials associated with CCW and CW choices, respectively. The solid line shows the difference between these two. Monkey Bi tended to become more converged during trials at the end of which a CCW choice was made.
Fig. 11.
Behavioral bias induced by the stimulus in the preceding trial. Only preceding trials in which the animal made correct responses are included. The abscissa shows the percentage of choices in the preferred direction of rotation (PREF) of the neuron following stimuli that were rotating in the PREF direction of the neuron (PREFn‖PREFn−1). The ordinate shows the percentage of choices in the PREF direction following of the neuron following stimuli rotating in the nonpreferred (NULL) direction of the neuron (PREFn‖NULLn−1). The_diagonal line_ in each plot shows the identity line. Points farther away from the identity line indicate a stronger behavioral bias that was associated with the direction of rotation presented on the previous correct trial. The _graph_on the left shows the data from monkey Mr; there is a slight preponderance of data points above the identity line, indicating a weak tendency to choose the direction of rotation opposite from that of the preceding correct trial. Conversely, Bi (right) more often repeated the choice of the preceding correct trial. In both cases,filled symbols indicate cases in which the choice probability was statistically significant for the individual neuron, and open symbols show cases in which it was not.
Fig. 12.
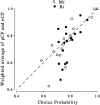
The influence of stimulation on the preceding trial on the choice probability. For all experiments in which the choice probability was significantly >0.5, the choice probability was calculated separately for trials that followed a preferred stimulus (pCP) and for trials that followed a null stimulus (nCP). If the difference between these groups was largely responsible for the choice probability, then the choice probability calculated within the groups should be substantially smaller than the overall choice probability. The choice probability calculated across all trials is plotted on the abscissa, and the weighted mean of the choice probabilities calculated from the two groups is shown on the ordinate. Most of the data points can be found along the identity line, so there is a good agreement between the two measures.
Fig. 13.
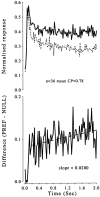
Time course of the neuronal responses to zero-disparity stimuli across all neurons with a significant choice probability. Top, Averaged normalized histograms (bin width of 20 msec) for choices corresponding to the preferred (PREF; solid line) and nonpreferred (NULL; dotted line) direction of rotation of the neurons. Bottom, Difference between the two histograms (PREF−NULL). The straight line shows the result of a linear least-squares regression for the period between 0.2 and 2.0 sec. This line has a slope of 0.02 normalized response units, which is significantly different from a line of zero slope (t test; p < 0.01).CP, Choice probability.
Similar articles
- Contribution of middle temporal area to coarse depth discrimination: comparison of neuronal and psychophysical sensitivity.
Uka T, DeAngelis GC. Uka T, et al. J Neurosci. 2003 Apr 15;23(8):3515-30. doi: 10.1523/JNEUROSCI.23-08-03515.2003. J Neurosci. 2003. PMID: 12716961 Free PMC article. - Linking neural representation to function in stereoscopic depth perception: roles of the middle temporal area in coarse versus fine disparity discrimination.
Uka T, DeAngelis GC. Uka T, et al. J Neurosci. 2006 Jun 21;26(25):6791-802. doi: 10.1523/JNEUROSCI.5435-05.2006. J Neurosci. 2006. PMID: 16793886 Free PMC article. - Correlated firing in macaque visual area MT: time scales and relationship to behavior.
Bair W, Zohary E, Newsome WT. Bair W, et al. J Neurosci. 2001 Mar 1;21(5):1676-97. doi: 10.1523/JNEUROSCI.21-05-01676.2001. J Neurosci. 2001. PMID: 11222658 Free PMC article. - Neural correlates of structure-from-motion perception in macaque V1 and MT.
Grunewald A, Bradley DC, Andersen RA. Grunewald A, et al. J Neurosci. 2002 Jul 15;22(14):6195-207. doi: 10.1523/JNEUROSCI.22-14-06195.2002. J Neurosci. 2002. PMID: 12122078 Free PMC article. - Interneuronal correlations at longer time scales predict decision signals for bistable structure-from-motion perception.
Wasmuht DF, Parker AJ, Krug K. Wasmuht DF, et al. Sci Rep. 2019 Aug 7;9(1):11449. doi: 10.1038/s41598-019-47786-1. Sci Rep. 2019. PMID: 31391489 Free PMC article.
Cited by
- Neuronal and Behavioral Responses to Naturalistic Texture Images in Macaque Monkeys.
Ziemba CM, Goris RLT, Stine GM, Perez RK, Simoncelli EP, Movshon JA. Ziemba CM, et al. J Neurosci. 2024 Oct 16;44(42):e0349242024. doi: 10.1523/JNEUROSCI.0349-24.2024. J Neurosci. 2024. PMID: 39197942 Free PMC article. - Decision-related activity and movement selection in primate visual cortex.
Laamerad P, Liu LD, Pack CC. Laamerad P, et al. Sci Adv. 2024 May 31;10(22):eadk7214. doi: 10.1126/sciadv.adk7214. Epub 2024 May 29. Sci Adv. 2024. PMID: 38809984 Free PMC article. - Motion direction is represented as a bimodal probability distribution in the human visual cortex.
Chetverikov A, Jehee JFM. Chetverikov A, et al. Nat Commun. 2023 Nov 22;14(1):7634. doi: 10.1038/s41467-023-43251-w. Nat Commun. 2023. PMID: 37993430 Free PMC article. - The role of binocular disparity and attention in the neural representation of multiple moving stimuli in the visual cortex.
Chakrala AS, Xiao J, Huang X. Chakrala AS, et al. bioRxiv [Preprint]. 2024 Sep 19:2023.06.25.546480. doi: 10.1101/2023.06.25.546480. bioRxiv. 2024. PMID: 37425944 Free PMC article. Preprint. - Visual motion perception as online hierarchical inference.
Bill J, Gershman SJ, Drugowitsch J. Bill J, et al. Nat Commun. 2022 Dec 1;13(1):7403. doi: 10.1038/s41467-022-34805-5. Nat Commun. 2022. PMID: 36456546 Free PMC article.
References
- Albright TD. Form–cue invariant motion processing in primate visual cortex. Science. 1992;255:1141–1142. - PubMed
- Albright TD, Desimone R. Local precision of visuotopic organization in the middle temporal area (MT) of the macaque. Exp Brain Res. 1987;65:582–592. - PubMed
- Bair W, O'Keefe LP. The influence of fixational eye movements on the response of neurons in area MT of the macaque. Vis Neurosci. 1998;15:779–786. - PubMed
- Bradley DC, Qian N, Andersen RA. Integration of motion and stereopsis in middle temporal cortical area of macaques. Nature. 1995;373:609–611. - PubMed
- Bradley DC, Chang GC, Andersen RA. Encoding of three-dimensional structure-from-motion by primate area MT neurons. Nature. 1998;392:714–717. - PubMed
Publication types
MeSH terms
LinkOut - more resources
Full Text Sources
Other Literature Sources


