Loss of poly(ADP-ribose) polymerase-1 causes increased tumour latency in p53-deficient mice - PubMed (original) (raw)
Loss of poly(ADP-ribose) polymerase-1 causes increased tumour latency in p53-deficient mice
C Conde et al. EMBO J. 2001.
Abstract
PARP-1-deficient mice display a severe defect in the base excision repair pathway leading to radiosensitivity and genomic instability. They are protected against necrosis induced by massive oxidative stress in various inflammatory processes. Mice lacking p53 are highly predisposed to malignancy resulting from defective cell cycle checkpoints, resistance to DNA damage-induced apoptosis as well as from upregulation of the iNOS gene resulting in chronic oxidative stress. Here, we report the generation of doubly null mutant mice. We found that tumour-free survival of parp-1(-/-)p53(-/-) mice increased by 50% compared with that of parp- 1(+/+)p53(-/-) mice. Tumour formation in nude mice injected with oncogenic parp-1(-/-)p53(-/-) fibroblasts was significantly delayed compared with parp-1(+/+)p53(-/-) cells. Upon gamma-irradiation, a partial restoration of S-phase radiosensitivity was found in parp-1(-/-)p53(-/-) primary fibroblasts compared with parp-1(+/+)p53(-/-) cells. In addition, iNOS expression and nitrite release were dramatically reduced in the parp-1(-/-)p53(-/-) mice compared with parp-1(+/+)p53(-/-) mice. The abrogation of the oxydated status of p53(-/-) cells, due to the absence of parp-1, may be the cause of the delay in the onset of tumorigenesis in parp-1(-/-)p53(-/-) mice.
Figures
Fig. 1. Kaplan–Meier plot of tumour incidence in parp-1+/+_p53_–/– and _parp-1_–/–_p53_–/– mice. The percentage of mice remaining tumour free versus mice alive at the outset is plotted against age. The difference was highly significant (p <10–5 by Gehan’s Wilcoxon test and p <10–5 by log-rank test). Note that during the time of study, no parp-1+/+p53+/+ or parp-1_–/–_p53+/+ mice died.
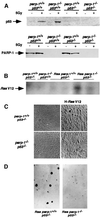
Fig. 2. (A) Western blot analysis of PARP-1 and p53 expression in nuclear (p53) or crude (PARP-1) extracts of MEFs of the indicated genotypes. p53 protein was induced after 5 Gy irradiation. (B) Southern blot of _Hin_dIII-digested DNA from parp-1+/+_p53_–/– and _parp-1_–/–_p53_–/– MEFs infected or not with H-ras V12 retrovirus, using the ras V12 probe. (C) Morphology of primary and transformed parp-1+/+p53+/+ and parp-1_–/–_p53 fibroblasts. (D) Anchorage-independent growth of transformed parp-1+/+_p53_–/– and _parp-1_–/–_p53_–/– fibroblasts.
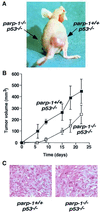
Fig. 3. (A) Tumour formation in BALB/c nude mice. This representative mouse was inoculated with transformed parp-1+/+_p53_–/– fibroblasts in the right thigh and transformed _parp-1_–/–_p53_–/– fibroblasts in the left thigh. (B) Tumour volume plot after s.c. injection of parp-1+/+_p53_–/– and _parp-1_–/–_p53_–/– transformed fibroblasts mixed in equal volume of Matrigel into Balb/c nude mice. For each genotype, six sites were injected. Each point represents the mean ± SD of measurements. The difference was significant at all data points (p <0.006, Mann–Whitney _U_-test).
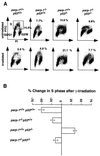
Fig. 4. (A) Representative flow cytometry scatter plots of MEFs nuclei 18 h after irradiation (5 Gy), plotted as increasing fluorescence of propidium iodide (PI; _x_-axis) versus increasing FITC fluorescence obtained with an anti-BrdU–FITC-conjugated antibody (_y_-axis). Gating for S-phase cells is shown in the panel from unirradiated wild-type mice (upper left). (B) Graph representing the mean ± SD change in the percentage of S-phase cells after irradiation (n = 3–6).
Fig. 5. Micronuclei formation in primary MEFs at passage 2 isolated from mice of the indicated genotypes. A total of 700–1000 binucleated cells in each genotype was counted.
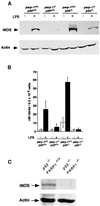
Fig. 6. (A) Western blot analysis of iNOS expression in crude extracts of peritoneal macrophages from mice of the genotypes indicated, 18 h after LPS treatment. Expression of actin is shown as a loading control. (B) Nitrite release in primary cultured murine macrophages from mice of the indicated genotype treated or not with 5 µg/ml LPS for 24 h. Each value represents the mean ± SD of three independent experiments. (C) iNOS expression in crude extracts of splenocytes derived from parp-1+/+_p53_–/– and _parp-1_–/–_p53_–/– mice.
Similar articles
- DNA strand break-sensing molecule poly(ADP-Ribose) polymerase cooperates with p53 in telomere function, chromosome stability, and tumor suppression.
Tong WM, Hande MP, Lansdorp PM, Wang ZQ. Tong WM, et al. Mol Cell Biol. 2001 Jun;21(12):4046-54. doi: 10.1128/MCB.21.12.4046-4054.2001. Mol Cell Biol. 2001. PMID: 11359911 Free PMC article. - Poly(ADP-ribose) polymerase inhibitors activate the p53 signaling pathway in neural stem/progenitor cells.
Okuda A, Kurokawa S, Takehashi M, Maeda A, Fukuda K, Kubo Y, Nogusa H, Takatani-Nakase T, Okuda S, Ueda K, Tanaka S. Okuda A, et al. BMC Neurosci. 2017 Jan 17;18(1):14. doi: 10.1186/s12868-016-0333-0. BMC Neurosci. 2017. PMID: 28095779 Free PMC article. - Poly(ADP-ribose) polymerase-1 regulates the stability of the wild-type p53 protein.
Wesierska-Gadek J, Schmid G. Wesierska-Gadek J, et al. Cell Mol Biol Lett. 2001;6(2):117-40. Cell Mol Biol Lett. 2001. PMID: 11544635 - DNA repair factors and telomere-chromosome integrity in mammalian cells.
Hande MP. Hande MP. Cytogenet Genome Res. 2004;104(1-4):116-22. doi: 10.1159/000077475. Cytogenet Genome Res. 2004. PMID: 15162024 Review. - [Analysis of the role of DNA repair, regulation of cell cycle and apoptosis in the radiation-induced adaptive response of mammalian cells].
Bodnarchuk IA. Bodnarchuk IA. Radiats Biol Radioecol. 2003 Jan-Feb;43(1):19-28. Radiats Biol Radioecol. 2003. PMID: 12677654 Review. Russian.
Cited by
- New facets in the regulation of gene expression by ADP-ribosylation and poly(ADP-ribose) polymerases.
Ryu KW, Kim DS, Kraus WL. Ryu KW, et al. Chem Rev. 2015 Mar 25;115(6):2453-81. doi: 10.1021/cr5004248. Epub 2015 Jan 9. Chem Rev. 2015. PMID: 25575290 Free PMC article. Review. No abstract available. - Principles of cancer therapy: oncogene and non-oncogene addiction.
Luo J, Solimini NL, Elledge SJ. Luo J, et al. Cell. 2009 Mar 6;136(5):823-37. doi: 10.1016/j.cell.2009.02.024. Cell. 2009. PMID: 19269363 Free PMC article. - Inhibition of poly (ADP-ribose) polymerase activates ATM which is required for subsequent homologous recombination repair.
Bryant HE, Helleday T. Bryant HE, et al. Nucleic Acids Res. 2006 Mar 23;34(6):1685-91. doi: 10.1093/nar/gkl108. Print 2006. Nucleic Acids Res. 2006. PMID: 16556909 Free PMC article. - PARP-1 and PARP-2: New players in tumour development.
Yelamos J, Farres J, Llacuna L, Ampurdanes C, Martin-Caballero J. Yelamos J, et al. Am J Cancer Res. 2011;1(3):328-346. Epub 2011 Jan 8. Am J Cancer Res. 2011. PMID: 21968702 Free PMC article. - Fine tuning the transcriptional regulation of the CXCL1 chemokine.
Amiri KI, Richmond A. Amiri KI, et al. Prog Nucleic Acid Res Mol Biol. 2003;74:1-36. doi: 10.1016/s0079-6603(03)01009-2. Prog Nucleic Acid Res Mol Biol. 2003. PMID: 14510072 Free PMC article. Review.
References
- Ambs S. et al. (1998a) p53 and vascular endothelial growth factor regulate tumor growth of NOS2-expressing human carcinoma cells. Nature Med., 4, 1371–1376. - PubMed
- Bauer P.I. et al. (1996) Modification of growth related enzymatic pathways and apparent loss of tumorigenicity of a ras-transformed bovine endothelial cell line by treatment with 5-iodo-6-amino-1,2-benzopyrone (INH2BP). Int. J. Oncol., 8, 239–252. - PubMed
- Berger N.A. (1985) Poly(ADP-ribose) in the cellular response to DNA damage. Radiat. Res., 101, 4–15. - PubMed
Publication types
MeSH terms
Substances
LinkOut - more resources
Full Text Sources
Other Literature Sources
Molecular Biology Databases
Research Materials
Miscellaneous


