The use of the indicator fluo-5N to measure sarcoplasmic reticulum calcium in single muscle fibres of the cane toad - PubMed (original) (raw)
The use of the indicator fluo-5N to measure sarcoplasmic reticulum calcium in single muscle fibres of the cane toad
A A Kabbara et al. J Physiol. 2001.
Abstract
1. Single fibres from the lumbrical muscles of the cane toad (Bufo marinus) were incubated in fluo-5N AM for 2 h at 35 degrees C in order to load the indicator into the sarcoplasmic reticulum. Fluo-5N is a low-affinity calcium indicator (K(Ca) 90 microM). Successful sarcoplasmic reticulum (SR) loading was indicated by a fluorescence signal that declined during contraction. 2. Confocal microscopy showed that the dye loaded principally in lines perpendicular to the long axis of the fibre that repeated each sarcomere. This is consistent with much of the dye residing in the SR. 3. To establish the site of loading, fibres were exposed to 30 mM caffeine in the presence of 20 microM 2,5-di(tert-butyl)1,4-hydroquinone (TBQ, an SR pump inhibitor) which should release most Ca(2+) from the SR; this procedure reduced the fluorescence to 46 +/- 4 % of the control value. To determine how much indicator was in the myoplasm, fibres were exposed to 100 microg ml(-1) saponin which permeabilizes the surface membrane; saponin treatment reduced the fluorescence to 51 +/- 2 % of the control value. 4. During maximally activated tetani (100 Hz stimulation rate, 22 degrees C) the component of signal from the SR declined by 33 +/- 4 %. During relaxation the SR signal recovered in two phases with time constants of 0.38 +/- 0.14 s and 10.1 +/- 1.7 s. Partially activated tetani (30 Hz stimulation rate) showed a smaller SR signal. Application of the SR Ca(2+) pump inhibitor TBQ slowed the rate of recovery of the SR signal. 5. Muscle fatigue was produced by repeated short tetani until tension was reduced to 50 %. The SR signal during the periods between tetani declined steadily and the SR Ca(2+) signal was eventually reduced to 71 +/- 8 % of the control signal. This signal recovered in two phases when the muscle was rested. An initial phase had a time constant of 1.7 +/- 0.2 s so that by 20 s of recovery the SR Ca(2+) signal was 86 +/- 7 % of control; the second phase was slower and by 5 min the SR Ca(2+) signal was back to control values (98 +/- 5 % control). In addition the magnitude of the SR signal decline associated with each tetanus (Delta[Ca(2+)](SR)) declined monotonically throughout fatigue and returned to control after 5 min recovery. 6. This approach can monitor the SR Ca(2+) concentration in normally functioning muscle fibres with good time resolution. The method confirms other approaches that show that the free Ca(2+) available for release in the SR declines during fatigue. This reduction in [Ca(2+)](SR) will contribute to the failure of Ca(2+) delivery to the myofilaments which is an important cause of muscle fatigue.
Figures
Figure 1. Distribution of fluo-5N fluorescence in single intact toad skeletal muscle fibres
The fibre was loaded with fluo-5N AM as described in the Methods. A, confocal image of section of a single fibre. Regions of high, medium and low fluorescence are coloured red, yellow and blue, respectively. The vertical bar represents 10 μm. B, line plot of fluo-5N fluorescence intensity (arbitrary units, a.u.) of a small (7 μm) region along the fibre. C, line plot of fluo-5N fluorescence intensity (a.u.) across the fibre.
Figure 2. Effect of SR Ca2+ depletion on fibre fluorescence
Upper panel shows fibre fluorescence (% initial level) and lower panel shows isometric tension of a single intact toad skeletal muscle fibre loaded with fluo-5N AM. The fibre was exposed to 20 μ
m
TBQ for 60 s and then 30 m
m
caffeine was applied as indicated by the bars. The fluorescence between the dashed lines represents the total SR Ca2+ signal.
Figure 3. Effects of saponin and high [Ca2+] on fibre fluorescence
Fibre fluorescence signal (% initial level) of a single intact toad skeletal muscle fibre loaded with fluo-5N AM, when the cell membrane was disrupted with 100 μg ml−1 saponin in Ringer solution. Note the large fall in fibre fluorescence after the treatment with saponin. EGTA (1 m
m
) was then applied in Hepes-buffered salt solution with no added Ca2+. When the signal became steady, 20 m
m
Ca2+ was added to this solution; note the large rise in the fluorescence. Finally the EGTA solution was reapplied as indicated by the bar and caused a fall in fibre fluorescence.
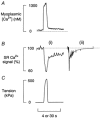
Figure 4. Composite figure showing various Ca2+ signals during a tetanus
A shows myoplasmic [Ca2+] from a fibre loaded with indo-1. B i and C show the SR Ca2+ signal and isometric tension during a 0.5 s 100 Hz tetanus (simultaneously recorded from another fibre). The SR Ca2+ signal is shown as the percentage of total SR Ca2+ signal. B ii shows the SR Ca2+ signal on a slower time base (30 s on time bar) from a third fibre.
Figure 5. Effects of stimulation frequency, stimulation duration and TBQ on SR Ca2+ signal and tension
A, effect of stimulation frequency. The fibre was stimulated either at 100 Hz (continuous line) or at 30 Hz (dashed line) with a 0.5 s duration. B, effect of tetanus duration. The fibre was stimulated at 100 Hz for 0.5, 1.0, 1, 1.5 and 8 s durations. C, effect of TBQ. The fibre was given a 100 Hz (0.5 s) tetanus in the absence of TBQ (continuous line), in the presence of 1 μ
m
TBQ (dashed line) and in the presence of 10 μ
m
TBQ (dotted and dashed line). The SR Ca2+ signal is shown as the percentage of total SR Ca2+ signal.
Figure 6. Effects of fatiguing stimulation on SR Ca2+ signal
A, the fibre loaded with fluo-5N underwent a fatiguing protocol until tension fell to 50 %. The 1st, 2nd and 3rd sets of records were obtained at the start, mid-point and end of the fatigue protocol. The fibre was then allowed to recover for 3 min (last set of records). The SR Ca2+ signal shown in the upper part is shown as the percentage of total SR Ca2+ signal. The dashed line shows the initial resting level. B, SR Ca2+ signal from another fibre showing the final period of fatiguing stimulation and the first 15 s of recovery. The dashed line shows an exponential curve fitted to the first 15 s of recovery.
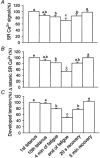
Figure 7. Average data of SR Ca2+ signals and tension during fatigue and recovery
Each column is the mean ±
s.e.m
. (n = 8). For each panel the bars show data for the 1st tetanus (expressed as 100 %), the 10th tetanus, 4 min of fatigue, the end of fatigue, 20 s recovery and 5 min recovery. A shows the resting SR Ca2+ signal (measured before the tetanus and expressed as a percentage of the total SR Ca2+ signal); B shows the change in SR Ca2+ signal during a tetanus; C shows developed tension. a, not signficantly different to control; b, not significantly different to the 4 min point; c, not significantly different to the end of fatigue. All other comparisons were significantly different (P < 0.05 on one way ANOVA).
Similar articles
- The role of calcium stores in fatigue of isolated single muscle fibres from the cane toad.
Kabbara AA, Allen DG. Kabbara AA, et al. J Physiol. 1999 Aug 15;519 Pt 1(Pt 1):169-76. doi: 10.1111/j.1469-7793.1999.0169o.x. J Physiol. 1999. PMID: 10432347 Free PMC article. - Intracellular calcium during fatigue of cane toad skeletal muscle in the absence of glucose.
Kabbara AA, Nguyen LT, Stephenson GM, Allen DG. Kabbara AA, et al. J Muscle Res Cell Motil. 2000;21(5):481-9. doi: 10.1023/a:1005650425513. J Muscle Res Cell Motil. 2000. PMID: 11129439 - Effect of saponin treatment on the sarcoplasmic reticulum of rat, cane toad and crustacean (yabby) skeletal muscle.
Launikonis BS, Stephenson DG. Launikonis BS, et al. J Physiol. 1997 Oct 15;504 ( Pt 2)(Pt 2):425-37. doi: 10.1111/j.1469-7793.1997.425be.x. J Physiol. 1997. PMID: 9365915 Free PMC article. - A study of the mechanisms of excitation-contraction coupling in frog skeletal muscle based on measurements of [Ca2+] transients inside the sarcoplasmic reticulum.
Olivera JF, Pizarro G. Olivera JF, et al. J Muscle Res Cell Motil. 2018 Apr;39(1-2):41-60. doi: 10.1007/s10974-018-9497-9. Epub 2018 Aug 24. J Muscle Res Cell Motil. 2018. PMID: 30143958 Review. - Impaired calcium release during fatigue.
Allen DG, Lamb GD, Westerblad H. Allen DG, et al. J Appl Physiol (1985). 2008 Jan;104(1):296-305. doi: 10.1152/japplphysiol.00908.2007. Epub 2007 Oct 25. J Appl Physiol (1985). 2008. PMID: 17962573 Review.
Cited by
- A chloride channel blocker prevents the suppression by inorganic phosphate of the cytosolic calcium signals that control muscle contraction.
Ferreira JJ, Pequera G, Launikonis BS, Ríos E, Brum G. Ferreira JJ, et al. J Physiol. 2021 Jan;599(1):157-170. doi: 10.1113/JP279917. Epub 2020 Oct 19. J Physiol. 2021. PMID: 32991741 Free PMC article. - Rapid subcellular calcium responses and dynamics by calcium sensor G-CatchER.
Reddish FN, Miller CL, Deng X, Dong B, Patel AA, Ghane MA, Mosca B, McBean C, Wu S, Solntsev KM, Zhuo Y, Gadda G, Fang N, Cox DN, Mabb AM, Treves S, Zorzato F, Yang JJ. Reddish FN, et al. iScience. 2021 Feb 3;24(3):102129. doi: 10.1016/j.isci.2021.102129. eCollection 2021 Mar 19. iScience. 2021. PMID: 33665552 Free PMC article. - Extraction of sub-microscopic Ca fluxes from blurred and noisy fluorescent indicator images with a detailed model fitting approach.
Kong CH, Laver DR, Cannell MB. Kong CH, et al. PLoS Comput Biol. 2013;9(2):e1002931. doi: 10.1371/journal.pcbi.1002931. Epub 2013 Feb 28. PLoS Comput Biol. 2013. PMID: 23468614 Free PMC article. - Transcription factor Foxo3a prevents apoptosis by regulating calcium through the apoptosis repressor with caspase recruitment domain.
Lu D, Liu J, Jiao J, Long B, Li Q, Tan W, Li P. Lu D, et al. J Biol Chem. 2013 Mar 22;288(12):8491-8504. doi: 10.1074/jbc.M112.442061. Epub 2013 Feb 4. J Biol Chem. 2013. PMID: 23382383 Free PMC article. - Detection of differentially regulated subsarcolemmal calcium signals activated by vasoactive agonists in rat pulmonary artery smooth muscle cells.
Subedi KP, Paudel O, Sham JS. Subedi KP, et al. Am J Physiol Cell Physiol. 2014 Apr 1;306(7):C659-69. doi: 10.1152/ajpcell.00341.2013. Epub 2013 Dec 18. Am J Physiol Cell Physiol. 2014. PMID: 24352334 Free PMC article.
References
- Allen DG, Lännergren J, Westerblad H. Muscle cell function during prolonged activity: cellular mechanisms of fatigue. Experimental Physiology. 1995;80:497–527. - PubMed
- Balnave CD, Allen DG. Evidence for Na+/Ca2+ exchange in intact single skeletal muscle fibers from the mouse. American Journal of Physiology. 1998;274:C940–946. - PubMed
Publication types
MeSH terms
Substances
LinkOut - more resources
Full Text Sources
Research Materials
Miscellaneous


