Abnormal development of dendritic spines in FMR1 knock-out mice - PubMed (original) (raw)
Abnormal development of dendritic spines in FMR1 knock-out mice
E A Nimchinsky et al. J Neurosci. 2001.
Abstract
Fragile X syndrome is caused by a mutation in the FMR1 gene leading to absence of the fragile X mental retardation protein (FMRP). Reports that patients and adult FMR1 knock-out mice have abnormally long dendritic spines of increased density suggested that the disorder might involve abnormal spine development. Because spine length, density, and motility change dramatically in the first postnatal weeks, we analyzed these properties in mutant mice and littermate controls at 1, 2, and 4 weeks of age. To label neurons, a viral vector carrying the enhanced green fluorescent protein gene was injected into the barrel cortex. Layer V neurons were imaged on a two-photon laser scanning microscope in fixed tissue sections. Analysis of >16,000 spines showed clear developmental patterns. Between 1 and 4 weeks of age, spine density increased 2.5-fold, and mean spine length decreased by 17% in normal animals. Early during cortical synaptogenesis, pyramidal cells in mutant mice had longer spines than controls. At 1 week, spine length was 28% greater in mutants than in controls. At 2 weeks, this difference was 10%, and at 4 weeks only 3%. Similarly, spine density was 33% greater in mutants than in controls at 1 week of age. At 2 or 4 weeks of age, differences were not detectable. The spine abnormality was not detected in neocortical organotypic cultures. The transient nature of the spine abnormality in the intact animal suggests that FMRP might play a role in the normal process of dendritic spine growth in coordination with the experience-dependent development of cortical circuits.
Figures
Fig. 1.
Two-photon laser scanning micrographs showing morphology of and spine development in EGFP-expressing layer V pyramidal neurons in the somatosensory cortex of wild-type (left) and mutant (right) mice transfected in vivo before fixation. Note the presence of long protrusions at 1 week, particularly in the mutant mice (arrows). Scale bars: A, B, 50 μm;C–H, 8 μm.
Fig. 2.
Developmental spine length changes in_FMR1_ knock-out mice and littermate controls. A, D, G, 1 week; B, E, H, 2 weeks; C, F, I, 4 weeks. A–C, Mean spine length in mutant and control mice. D–F, Cumulative frequency distribution of spine lengths. G–I, Mean spine length at different branching levels in the dendritic tree. In_D–F_, black areas indicate wild type and_white areas_ indicate mutant. In_G–I_, black bars indicate wild type and_gray bars_ indicate mutant. ap1–3, Primary through tertiary apical dendrites; bas1–3, primary through tertiary basal dendrites. Error bars indicate SEM. *p < 0.05; **p < 0.001; ***p < 0.0001.
Fig. 3.
Developmental spine density changes in_FMR1_ knock-out mice and littermate controls. A, D, 1 week; B, E, 2 weeks; C, F, 4 weeks. A–C, Mean spine density in mutant and control mice. D–F, Mean spine density at different branching levels in the dendritic tree. Means are shown only for primary and secondary dendrites, because the number of tertiary dendrites sampled was too inconsistent to provide reliable estimates. Black bars, Wild type; gray bars, mutant.ap1–2, Primary through tertiary apical dendrites; bas1–2, primary through tertiary basal dendrites. Error bars indicate SEM. *p < 0.05; **p < 0.001; ***p < 0.0001.
Fig. 4.
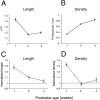
A, C, Summary of changes in spine length (A) and density (C) in wild-type mice during the first postnatal month. n = 5 animals in each group. Error bars indicate SEM. B, D, Summary of changes in spine length (B) and density (D) in mutant mice during the first postnatal month. The value for each parameter is normalized to the wild-type value. Error bars are computed as the sum of the SEM for wild-type and mutant animals.n = 5 animals in each group.
Fig. 5.
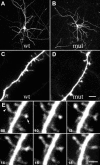
Two-photon laser scanning micrographs of biolistically transfected layer V neurons in neocortical organotypic cultures at 1 week from the date of birth. A, C, Wild type. B, D, Mutant. A, B, Low-magnification projections showing pyramidal morphology. C, D, High-magnification projections of dendritic segments. Note the increased presence of long protrusions in this preparation. Scale bar: A, B, 50 μm; C, D, 4 μm.E, Spine motility in neocortical cultures imaged using 2PLSM at 1 week from the date of birth. Micrographs taken at 2 min intervals show typical changes in spine morphology. One protrusion (arrow) changes shape several times during this interval, branching, extending, and retracting. Another (arrowhead) undergoes changes in the morphology of its head. Others change relatively little during this interval. This example was taken from a wild-type animal. Numbers indicate time in minutes. Scale bar, 2 μm.
Fig. 6.
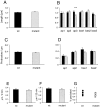
Spine length and density in neocortical cultures analyzed 1 week from the date of birth. A, Mean spine length; n = 1754 and 1667 spines for wt and mutant animals, respectively. B, Spine length at different levels in the dendritic tree. C, Mean spine density; n = 247 and 255 dendritic segments for wt and mutant, respectively. D, Spine density at different levels in the dendritic tree. E–G, Spine motility in neocortical cultures analyzed 1 week from the date of birth.E, Mean motility per 2 min time interval.F, Mean length range over which spines vary over a 22 min time interval. G, Proportion-persistent spines for wild-type and mutant animals. Black, Wild type;gray, mutant. ap1–3, Primary through tertiary apical dendrites; bas1–3, primary through tertiary basal dendrites. Error bars indicate SEM. *p < 0.05; **p < 0.001; ***p < 0.0001.
Similar articles
- Fragile X-like behaviors and abnormal cortical dendritic spines in cytoplasmic FMR1-interacting protein 2-mutant mice.
Han K, Chen H, Gennarino VA, Richman R, Lu HC, Zoghbi HY. Han K, et al. Hum Mol Genet. 2015 Apr 1;24(7):1813-23. doi: 10.1093/hmg/ddu595. Epub 2014 Nov 28. Hum Mol Genet. 2015. PMID: 25432536 Free PMC article. - Somatosensory cortical barrel dendritic abnormalities in a mouse model of the fragile X mental retardation syndrome.
Galvez R, Gopal AR, Greenough WT. Galvez R, et al. Brain Res. 2003 May 2;971(1):83-9. doi: 10.1016/s0006-8993(03)02363-1. Brain Res. 2003. PMID: 12691840 - Dendritic spine abnormalities in the occipital cortex of C57BL/6 Fmr1 knockout mice.
McKinney BC, Grossman AW, Elisseou NM, Greenough WT. McKinney BC, et al. Am J Med Genet B Neuropsychiatr Genet. 2005 Jul 5;136B(1):98-102. doi: 10.1002/ajmg.b.30183. Am J Med Genet B Neuropsychiatr Genet. 2005. PMID: 15892134 - A decade of molecular studies of fragile X syndrome.
O'Donnell WT, Warren ST. O'Donnell WT, et al. Annu Rev Neurosci. 2002;25:315-38. doi: 10.1146/annurev.neuro.25.112701.142909. Epub 2002 Mar 20. Annu Rev Neurosci. 2002. PMID: 12052912 Review. - Dendritic spine structural anomalies in fragile-X mental retardation syndrome.
Irwin SA, Galvez R, Greenough WT. Irwin SA, et al. Cereb Cortex. 2000 Oct;10(10):1038-44. doi: 10.1093/cercor/10.10.1038. Cereb Cortex. 2000. PMID: 11007554 Review.
Cited by
- Decreasing-Rate Pruning Optimizes the Construction of Efficient and Robust Distributed Networks.
Navlakha S, Barth AL, Bar-Joseph Z. Navlakha S, et al. PLoS Comput Biol. 2015 Jul 28;11(7):e1004347. doi: 10.1371/journal.pcbi.1004347. eCollection 2015 Jul. PLoS Comput Biol. 2015. PMID: 26217933 Free PMC article. - Temporal-specific roles of fragile X mental retardation protein in the development of the hindbrain auditory circuit.
Wang X, Kohl A, Yu X, Zorio DAR, Klar A, Sela-Donenfeld D, Wang Y. Wang X, et al. Development. 2020 Aug 25;147(21):dev188797. doi: 10.1242/dev.188797. Development. 2020. PMID: 32747436 Free PMC article. - Essential contribution of the ligand-binding beta B/beta C loop of PDZ1 and PDZ2 in the regulation of postsynaptic clustering, scaffolding, and localization of postsynaptic density-95.
Nonaka M, Doi T, Fujiyoshi Y, Takemoto-Kimura S, Bito H. Nonaka M, et al. J Neurosci. 2006 Jan 18;26(3):763-74. doi: 10.1523/JNEUROSCI.2489-05.2006. J Neurosci. 2006. PMID: 16421296 Free PMC article. - Activity-dependent modulation of neural circuit synaptic connectivity.
Tessier CR, Broadie K. Tessier CR, et al. Front Mol Neurosci. 2009 Jul 30;2:8. doi: 10.3389/neuro.02.008.2009. eCollection 2009. Front Mol Neurosci. 2009. PMID: 19668708 Free PMC article. - Regulation of synaptic structure and function by FMRP-associated microRNAs miR-125b and miR-132.
Edbauer D, Neilson JR, Foster KA, Wang CF, Seeburg DP, Batterton MN, Tada T, Dolan BM, Sharp PA, Sheng M. Edbauer D, et al. Neuron. 2010 Feb 11;65(3):373-84. doi: 10.1016/j.neuron.2010.01.005. Neuron. 2010. PMID: 20159450 Free PMC article.
References
- Braun K, Segal M. FMRP involvement in formation of synapses among cultured hippocampal neurons. Cereb Cortex. 2000;10:1045–1052. - PubMed
- Brown V, Small K, Lakkis L, Feng Y, Gunter C, Wilkinson KD, Warren ST (1998) Purified recombinant Fmrp exhibits selective RNA binding as an intrinsic property of the fragile X mental retardation protein. J Biol Chem 15521–15527. - PubMed
- Caeser M, Schuz A. Maturation of neurons in neocortical slice cultures: a light and electron microscopic study on in situ and in vitro material. J Hirnforsch. 1992;33:429–443. - PubMed
- Caesar M, Bonhoeffer T, Bolz J. Cellular organization and development of slice cultures from rat visual cortex. Exp Brain Res. 1989;77:234–244. - PubMed
- Chen B, Lendvai B, Nimchinsky EA, Burbach B, Fox K, Svoboda K. Imaging high-resolution structure of GFP-expressing neurons in neocortex in vivo. Learn Mem. 2000;7:433–441. - PubMed
Publication types
MeSH terms
Substances
LinkOut - more resources
Full Text Sources
Other Literature Sources
Medical
Molecular Biology Databases


