From hematopoiesis to neuropoiesis: evidence of overlapping genetic programs - PubMed (original) (raw)
From hematopoiesis to neuropoiesis: evidence of overlapping genetic programs
A V Terskikh et al. Proc Natl Acad Sci U S A. 2001.
Abstract
It is reasonable to propose that gene expression profiles of purified stem cells could give clues for the molecular mechanisms of stem cell behavior. We took advantage of cDNA subtraction to identify a set of genes selectively expressed in mouse adult hematopoietic stem cells (HSC) as opposed to bone marrow (BM). Analysis of HSC-enriched genes revealed several key regulatory gene candidates, including two novel seven transmembrane (7TM) receptors. Furthermore, by using cDNA microarray techniques we found a large set of HSC-enriched genes that are expressed in mouse neurospheres (a population greatly enriched for neural progenitor cells), but not present in terminally differentiated neural cells. In situ hybridization demonstrated that many of them, including one HSC-enriched 7TM receptor, were selectively expressed in the germinal zones of fetal and adult brain, the regions harboring mouse neural stem cells. We propose that at least some of the transcripts that are selectively and commonly expressed in two or more types of stem cells define a functionally conserved group of genes evolved to participate in basic stem cell functions, including stem cell self-renewal.
Figures
Figure 1
Analysis of genes found in the HB library. (A) Categorization by sequence type. (B) Functional clustering of known (or highly homologous) genes. (C) Sequence composition of 223 nonredundant contigs.
Figure 2
The reverse transcription–PCR analysis of selected genes found in the HB library. Each gene was tested by using three independently prepared samples of double-sorted HSC and BM.
Figure 3
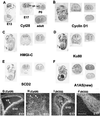
In situ hybridization analysis of HSC-NS common-specific genes. (A_–_F) Bright field images: E13 whole embryo, E17 head, P1 brain, and adult brain. (G_–_J) Emulsion-dipped autoradiograms:G and I, brains; H, liver;J, cranial nerve 5. (Scale bar, 250 μm.)
Figure 4
Schematic representation of gene expression in different stem cell populations.
Comment in
- Chipping away at stem cells.
Chu VT, Gage FH. Chu VT, et al. Proc Natl Acad Sci U S A. 2001 Jul 3;98(14):7652-3. doi: 10.1073/pnas.141244198. Proc Natl Acad Sci U S A. 2001. PMID: 11438717 Free PMC article. No abstract available.
Similar articles
- The homeodomain gene Pitx2 is expressed in primitive hematopoietic stem/progenitor cells but not in their differentiated progeny.
Degar BA, Baskaran N, Hulspas R, Quesenberry PJ, Weissman SM, Forget BG. Degar BA, et al. Exp Hematol. 2001 Jul;29(7):894-902. doi: 10.1016/s0301-472x(01)00661-0. Exp Hematol. 2001. PMID: 11438212 - A stem cell molecular signature.
Ivanova NB, Dimos JT, Schaniel C, Hackney JA, Moore KA, Lemischka IR. Ivanova NB, et al. Science. 2002 Oct 18;298(5593):601-4. doi: 10.1126/science.1073823. Epub 2002 Sep 12. Science. 2002. PMID: 12228721 - Differential expression of Hox, Meis1, and Pbx1 genes in primitive cells throughout murine hematopoietic ontogeny.
Pineault N, Helgason CD, Lawrence HJ, Humphries RK. Pineault N, et al. Exp Hematol. 2002 Jan;30(1):49-57. doi: 10.1016/s0301-472x(01)00757-3. Exp Hematol. 2002. PMID: 11823037 - Synergistic use of adult and embryonic stem cells to study human hematopoiesis.
Martin CH, Kaufman DS. Martin CH, et al. Curr Opin Biotechnol. 2005 Oct;16(5):510-5. doi: 10.1016/j.copbio.2005.07.007. Curr Opin Biotechnol. 2005. PMID: 16095900 Review. - microRNAs in hematopoiesis.
Lazare SS, Wojtowicz EE, Bystrykh LV, de Haan G. Lazare SS, et al. Exp Cell Res. 2014 Dec 10;329(2):234-8. doi: 10.1016/j.yexcr.2014.08.033. Epub 2014 Sep 3. Exp Cell Res. 2014. PMID: 25192911 Review.
Cited by
- Adult human hematopoietic stem cells produce neurons efficiently in the regenerating chicken embryo spinal cord.
Sigurjonsson OE, Perreault MC, Egeland T, Glover JC. Sigurjonsson OE, et al. Proc Natl Acad Sci U S A. 2005 Apr 5;102(14):5227-32. doi: 10.1073/pnas.0501029102. Epub 2005 Mar 24. Proc Natl Acad Sci U S A. 2005. PMID: 15790679 Free PMC article. - Trophic factor induction of human umbilical cord blood cells in vitro and in vivo.
Chen N, Kamath S, Newcomb J, Hudson J, Garbuzova-Davis S, Bickford P, Davis-Sanberg C, Sanberg P, Zigova T, Willing A. Chen N, et al. J Neural Eng. 2007 Jun;4(2):130-45. doi: 10.1088/1741-2560/4/2/013. Epub 2007 Apr 4. J Neural Eng. 2007. PMID: 17409487 Free PMC article. - Transcription of the human EAP1 gene is regulated by upstream components of a puberty-controlling Tumor Suppressor Gene network.
Mueller JK, Koch I, Lomniczi A, Loche A, Rulfs T, Castellano JM, Kiess W, Ojeda S, Heger S. Mueller JK, et al. Mol Cell Endocrinol. 2012 Apr 4;351(2):184-98. doi: 10.1016/j.mce.2011.12.004. Epub 2011 Dec 19. Mol Cell Endocrinol. 2012. PMID: 22209758 Free PMC article. - Legume lectin FRIL preserves neural progenitor cells in suspension culture in vitro.
Yao H, Xie X, Li Y, Wang D, Han S, Shi S, Nan X, Bai C, Wang Y, Pei X. Yao H, et al. Clin Dev Immunol. 2008;2008:531317. doi: 10.1155/2008/531317. Clin Dev Immunol. 2008. PMID: 18695740 Free PMC article.
References
- Weissman I L. Immunity. 1994;1:529–531. - PubMed
- Aguila H L, Akashi K, Domen J, Gandy K L, Lagasse E, Mebius R E, Morrison S J, Shizuru J, Strober S, Uchida N, et al. Immunol Rev. 1997;157:13–40. - PubMed
- Morrison S J, Shah N M, Anderson D J. Cell. 1997;88:287–298. - PubMed
Publication types
MeSH terms
Grants and funding
- MH60233/MH/NIMH NIH HHS/United States
- MH062800/MH/NIMH NIH HHS/United States
- R37 MH060233/MH/NIMH NIH HHS/United States
- R01 MH060233/MH/NIMH NIH HHS/United States
- R56 MH060233/MH/NIMH NIH HHS/United States
LinkOut - more resources
Full Text Sources
Other Literature Sources
Medical
Molecular Biology Databases


