Control of cell division by a retinoblastoma protein homolog in Chlamydomonas - PubMed (original) (raw)
Control of cell division by a retinoblastoma protein homolog in Chlamydomonas
J G Umen et al. Genes Dev. 2001.
Abstract
A key pathway that controls both cell division and differentiation in animal cells is mediated by the retinoblastoma (RB) family of tumor suppressors, which gate the passage of cells from G(1) to S and through S phase. The role(s) of the RB pathway in plants are not yet clearly defined, nor has there been any evidence for its presence in unicellular organisms. Here we have identified an RB homolog encoded by the mat3 gene in Chlamydomonas reinhardtii, a unicellular green alga in the land plant lineage. Chlamydomonas cells normally grow to many times their original size during a prolonged G(1) and then undergo multiple alternating rounds of S phase and mitosis to produce daughter cells of uniform size. mat3 mutants produce small daughter cells and show defects in two size-dependent cell cycle controls: They initiate the cell cycle at a below-normal size, and they undergo extra rounds of S phase/mitosis. Unlike mammalian RB mutants, mat3 mutants do not have a shortened G(1), do not enter S phase prematurely, and can exit the cell cycle and differentiate normally, indicating that the RB pathway in Chlamydomonas has a different role than in animals.
Figures
Figure 1
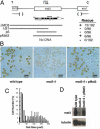
Characterization and complementation of_mat3-4_ deletion. (A) Structure of the mat3_locus showing locations of flanking genes thi10 and_ezy1 and the relative orientation to the linkage group VI centromere (C) and telomere (T) (Ferris and Goodenough 1994). The extent of the mat3-4 deletion is indicated below with the approximate location of the endpoints indicated by parentheses. The_mat3_ transcription unit is denoted with coding regions in black and locations of initiator (AUG), terminator (UGA), and polyadenylation sites (AAAn) labeled. The location of a 1-kb cDNA probe used for Northern blotting is shown as a black bar above the transcript. Clones used for cotransformational rescue are indicated below the transcript map by stippled lines, with numbers of transformants rescued/number screened and ability to rescue (+ or −) indicated to the right. (B) Photomicrographs of gametes from wild type, mat3-4, and mat3-4 following transformational rescue by pMat3. (C) Size distribution of cells from a wild-type strain (open bars), mat3-4 strain (black bars), and a mat3-4 strain that has been rescued by transformation with pMat3 (hatched lines). (D) Northern blot of total RNA from a wild-type strain, mat3-4, and_mat3-4_ that has been rescued with pMat3. The upper panel has been probed with the cDNA diagrammed in panel A. The lower panel is the same blot reprobed with a _Chlamydomonas_β-tubulin cDNA as a control for loading and RNA integrity.
Figure 2
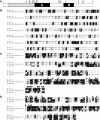
Homology between Mat3p and RB proteins. (A) Schematic of Mat3p showing locations of homology with the A and B domains of other RB proteins (black boxes) and additional homology with plant RB proteins (hatched region). (Asterisks) Potential CDK phosphorylation sites (S/T P). (B) Alignment of the plant-specific domain of mat3 (Gen Bank AF375824; residues 67–404) and Arabidopsis retinoblastoma related protein (Gen Bank AAF79146; residues 73–384; identity/similarity 23%/35%). Alignments were generated using the ClustalW program and formatted with Boxshade. (Black) Identity; (shading) similarity. (C) Alignment of domain A from mat3 (residues 423–626),Arabidopsis retinoblastoma related protein (residues 406–607; identity/similarity 31%/40%), and human RB (SWISS-PROT P06400, residues 373–573; identity/similarity 26%/41%). (Black squares) Residues that form contacts between domains A and B (Lee et al. 1998). (D) Alignment of domain B from mat3 (residues 818–949), Arabidopsis retinoblastoma related protein (733–862; identity/similarity 39%/55%), and human RB (650–770; identity/similarity 32%/48%). (Black squares) same as in panel_C_; (open circles) residues that form the LXCXE binding pocket in human RB (Lee et al. 1998).
Figure 3
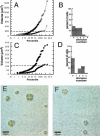
Cell cycle analysis of asynchronous wild-type and_mat3-4_ cultures. (A,C) Volume distributions of wild-type (A) and mat3-4 (C) strains grown asynchronously in continuous light and kept in log phase for at least 14 generations (squares), then shifted to the dark for 24 h (circles). The _X_-axis is a logarithmic scale showing the percentile ranking of cells by size. The horizontal dashed lines indicate volumes of 178 μm3 (A) and 110 μm3 (C), which are the respective commitment size thresholds for wild-type and mat3-4 strains. (B,D) Wild-type (B) and mat3-4_cells (D) from continuous light cultures in A and_C were plated in the dark. After 24 h dark incubation, cells were scored for the number of divisions they underwent and the results plotted as percentages of cells in each division number category. (E,F) Photomicrographs of division clusters from wild-type (E) and mat3-4 (F) strains.
Figure 4
Cell cycle analysis of synchronized wild-type and_mat3-4_ cultures. (A and B) Division number histograms of wild-type (A) and mat3-4 (B) strains. Dark-incubated cultures from Fig. 3 were returned to the light, and at the indicated times an aliquot of cells was removed and plated in the dark. The division numbers of the cells are plotted as in Fig. 3. (0 h) Beginning of the light period. (C_–_E) Cell number (triangles), DNA content (squares), and mitotic state (circles) were analyzed at the indicated times for wild-type (open symbols) and mat3-4 (filled symbols) cultures as they grew continuously in the light.
Figure 5
Schematic of how Mat3p functions in the_Chlamydomonas_ cell cycle. A single round of the cell cycle is represented by a time line broken into a long G1 and a short S phase/mitotic period (S/M). The commitment point is also indicated. Mat3p responds to cell size and represses the transition to commitment and, later, the multiple rounds of S phase and mitosis that occur at the end of each cell cycle. When cells are larger than a specific size threshold of ∼178 μm3, Mat3p-mediated repression is lifted, allowing either passage through commitment or continued cell division during S phase/mitosis. Repression is reestablished when daughter cell sizes fall below 178 μm3. Further details are in the Discussion.
Similar articles
- A suppressor screen in chlamydomonas identifies novel components of the retinoblastoma tumor suppressor pathway.
Fang SC, Umen JG. Fang SC, et al. Genetics. 2008 Mar;178(3):1295-310. doi: 10.1534/genetics.107.085977. Genetics. 2008. PMID: 18385113 Free PMC article. - Cell size checkpoint control by the retinoblastoma tumor suppressor pathway.
Fang SC, de los Reyes C, Umen JG. Fang SC, et al. PLoS Genet. 2006 Oct 13;2(10):e167. doi: 10.1371/journal.pgen.0020167. Epub 2006 Aug 17. PLoS Genet. 2006. PMID: 17040130 Free PMC article. - Retinoblastoma protein: combating algal bloom.
Cross FR, Roberts JM. Cross FR, et al. Curr Biol. 2001 Oct 16;11(20):R824-7. doi: 10.1016/s0960-9822(01)00495-x. Curr Biol. 2001. PMID: 11676936 Review. - Regulation of the Chlamydomonas cell cycle by a stable, chromatin-associated retinoblastoma tumor suppressor complex.
Olson BJ, Oberholzer M, Li Y, Zones JM, Kohli HS, Bisova K, Fang SC, Meisenhelder J, Hunter T, Umen JG. Olson BJ, et al. Plant Cell. 2010 Oct;22(10):3331-47. doi: 10.1105/tpc.110.076067. Epub 2010 Oct 26. Plant Cell. 2010. PMID: 20978220 Free PMC article. - Prospects for molecular farming in the green alga Chlamydomonas.
Franklin SE, Mayfield SP. Franklin SE, et al. Curr Opin Plant Biol. 2004 Apr;7(2):159-65. doi: 10.1016/j.pbi.2004.01.012. Curr Opin Plant Biol. 2004. PMID: 15003216 Review.
Cited by
- An Evolutionarily Conserved DOF-CONSTANS Module Controls Plant Photoperiodic Signaling.
Lucas-Reina E, Romero-Campero FJ, Romero JM, Valverde F. Lucas-Reina E, et al. Plant Physiol. 2015 Jun;168(2):561-74. doi: 10.1104/pp.15.00321. Epub 2015 Apr 20. Plant Physiol. 2015. PMID: 25897001 Free PMC article. - Quantitative analysis of cell-type specific gene expression in the green alga Volvox carteri.
Nematollahi G, Kianianmomeni A, Hallmann A. Nematollahi G, et al. BMC Genomics. 2006 Dec 21;7:321. doi: 10.1186/1471-2164-7-321. BMC Genomics. 2006. PMID: 17184518 Free PMC article. - A shift toward smaller cell size via manipulation of cell cycle gene expression acts to smoothen Arabidopsis leaf shape.
Kuwabara A, Backhaus A, Malinowski R, Bauch M, Hunt L, Nagata T, Monk N, Sanguinetti G, Fleming A. Kuwabara A, et al. Plant Physiol. 2011 Aug;156(4):2196-206. doi: 10.1104/pp.111.176073. Epub 2011 Jun 1. Plant Physiol. 2011. PMID: 21632970 Free PMC article. - Evolution of reproductive development in the volvocine algae.
Hallmann A. Hallmann A. Sex Plant Reprod. 2011 Jun;24(2):97-112. doi: 10.1007/s00497-010-0158-4. Epub 2010 Dec 21. Sex Plant Reprod. 2011. PMID: 21174128 Free PMC article. Review. - A suppressor screen in chlamydomonas identifies novel components of the retinoblastoma tumor suppressor pathway.
Fang SC, Umen JG. Fang SC, et al. Genetics. 2008 Mar;178(3):1295-310. doi: 10.1534/genetics.107.085977. Genetics. 2008. PMID: 18385113 Free PMC article.
References
- Chapman RL, Buchheim MA, Delwiche CF, Friedl T, Huss VAR, Karol KG, Lewis LA, Manhart J, McCourt RM, Olsen JL, et al. Molecular systematics of the green algae. In: Soltis P, et al., editors. Molecular systematics of plants II. Boston: Kluwer; 1998.
- Coleman AW. The nuclear cell cycle in Chlamydomonas(Chlorophyceae) J Phycol. 1982;18:192–195.
- Craigie RA, Cavalier-Smith T. Cell volume and the control of the Chlamydomonascell cycle. J Cell Sci. 1982;54:173–191.
Publication types
MeSH terms
Substances
LinkOut - more resources
Full Text Sources
Other Literature Sources


