Characterization of homologous recombination induced by replication inhibition in mammalian cells - PubMed (original) (raw)
Characterization of homologous recombination induced by replication inhibition in mammalian cells
Y Saintigny et al. EMBO J. 2001.
Abstract
To analyze relationships between replication and homologous recombination in mammalian cells, we used replication inhibitors to treat mouse and hamster cell lines containing tandem repeat recombination substrates. In the first step, few double-strand breaks (DSBs) are produced, recombination is slightly increased, but cell lines defective in non-homologous end-joining (NHEJ) affected in ku86 (xrs6) or xrcc4 (XR-1) genes show enhanced sensitivity to replication inhibitors. In the second step, replication inhibition leads to coordinated kinetics of DSB accumulation, Rad51 foci formation and RAD51-dependent gene conversion stimulation. In xrs6 as well as XR-1 cell lines, Rad51 foci accumulate more rapidly compared with their respective controls. We propose that replication inhibition produces DSBs, which are first processed by the NHEJ; then, following DSB accumulation, RAD51 recombination can act.
Figures
Fig. 1. Arrest of cell cycle progression by replication inhibitors, measured by flow cytometry analysis. The cell cycle phases are determined by the DNA content measured by flow cytometry [5-bromo-2-deoxyuridine (BrdU) incorporation being inhibited by the drug]. (A) Effect of different times of contact with two different concentrations of aphidicolin. The aphidicolin concentrations are indicated on the left and the different times of contact are indicated at the top of the figure. (B) Cell cycle distribution after 24 h of treatment with the different drugs. Concentrations were: 200 µM mimosine; 1 mM hydroxyurea; 20 µM ciclopirox olamine; 6 µM aphidicolin.
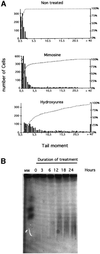
Fig. 2. DNA breaks induced by replication inhibitors. (A) The COMET assay measures single- and double-strand breaks. The amount of breaks is estimated by the tail moment: fraction of the DNA in the tail × distance between the mass center of the head and the mass center of the tail. The histograms correspond to the tail moments after 24 h of treatment with the replication inhibitors (indicated on the tops of the histograms). The bars correspond to the number of cells with the value of tail moment. The amount of breaks is correlated with the tail moment values. The curves (gray squares) indicate the cumulative percentage of cells. (B) PFGE detects the DSBs. The different times of contact with hydroxyurea are indicated on the top of the gel.
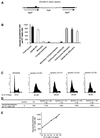
Fig. 3. Induction of recombination by elongation inhibitors in S phase. (A) The cell line used is hamster CHO-DRA10 containing the recombination substrate drawn and described elsewhere (Liang et al., 1998). This substrate contains a direct repeat of two inactive neomycin-resistant (NEO) genes; parental cells are sensitive to G418. Recombination restores a functional NEO gene; recombinants are resistant to G418. The frequency of spontaneous recombination is 6 × 10⁻⁷. (B) Induced recombinant corresponds to the number of G418-resistant clones for 107 viable treated cells subtracted from the number of G418-resistant clones in 107 non-treated viable cells. Cells were treated for 24 h with the drugs or the combinations indicated below the bars. Concentrations were: 200 µM mimosine; 1 mM hydroxyurea; 20 µM ciclopirox olamine; 0.6 µM aphidicolin. (C) Synchronization (indicated as ‘synchro’ in the figure) by double thymidine block. The DNA content is measured by FACS at different times after the release of the second thymidine block. H+0h: 0 h after the thymidine block release; H+1h: 1 h after the thymidine block release; H+2h: 2 h after the thymidine block release; H+3h: 3 h after the thymidine block release. The percentage of cells in the S phase is indicated on the histogram. (D) Induced recombinant under the different conditions. Synchro: synchronization by double thymidine block; HU: treatment with hydroxyurea for 24 h. H+ 0, 1, 2 or 3 h indicates the moment of hydroxyurea addition after the thymidine block release. (E) HU-induced recombinant as a function of the percentage of cells in the S phase at the beginning of the HU treatment. These values correspond to the progression in S phase (see Figure 3C).
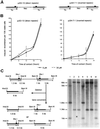
Fig. 4. Treatment with aphidicolin induces recombination as a function of the time of contact with the drug. (A) The cell lines derive from mouse L-cells. The recombination substrates are depicted on the figure and have been described elsewhere (Liskay et al., 1984). The cell line pJS3-10 contains direct repeat recombination substrates (on the left). The cell line pJS4-7-1 contains inverted repeat recombination substrates (on the right). (B) Induction of recombination between direct repeats (pJS3-10, on the left) or between inverted repeats (pJS4-7-1, on the right). The duration of treatment and the aphidicolin concentrations are indicated in the figure. (C) Example of Southern blotting of recombinant clones (probed with a TK sequence). On the left panel is the restriction map of the direct repeats substrate. After triple digestion (_Hin_dIII, _Bam_HI, _Xho_I), a deletion event will produce a 6 kb (_Hin_dIII–_Bam_HI) fragment. Gene conversion will produce either 5, 1.8 and 1 kb bands or 6, 1.3 and 0.5 kb bands; however, the 0.5 kb bands are usually hard to detect in these kinds of gels (Liskay et al., 1984). On the right is one example of Southern blotting for gene conversion events. The numbers on the top correspond to different clones double-resistant HATR(Tk+)/G418R(Neo); nr: non-recombinant parental line (pJS3-10). The sizes of the restriction fragments are indicated on the left side of the panel.
Fig. 5. Role of RAD51 in the induction of recombination by hydroxyurea. (A) and (B) Rad51 foci accumulation during hydroxyurea treatment. (A) Example of Rad51 foci. (B) Percentage of cells with Rad51 foci as a function of the time of contact (h) with hydroxyurea. The percentage of cells in the S phase for each time of contact with hydroxyurea is indicated in the figure. (C) and (D) Effect of the status of RAD51 on the RIRI. (C) Recombination induction as a function of the duration of treatment. (D) Survival (cloning efficiency) as a function of the duration of treatment. The duration of treatment is indicated in the figure. The names of the cell lines are indicated in the figure. The values correspond to the mean of three independent experiments. Error bars are omitted to avoid overloading the figure since the percentages of survival are not significantly different. CHO-DRA10 is the parental cell line; C2 is CHO-DRA10 transfected with the empty vector. These two lines are control lines. F1.4.1 and F1.4.2 are two independent lines expressing the RAD51 dominant-negative form (hypo-rec). Rm2 and Rm4 are two independent lines over-expressing MmRAD51 (hyper-rec).
Fig. 6. Sensitivity of the _ku86_– mutant xrs6 line (A) and of the _xrcc4_– mutant XR-1 line (B), or the XR-1 line complemented with the XRCC4 cDNA (C), as a function of the duration of treatment with hydroxyurea. The names and phenotypes of the cell lines are indicated in the figure. X4C and X4V are two independent XR-1 deriving clones, complemented with the XRCC4 cDNA.
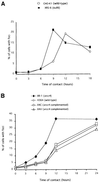
Fig. 7. Kinetics of Rad51 foci accumulation in the _ku86_– xrs6 line (A) or the _xrcc4_– XR-1 line and its derivatives (B). The values indicate the percentage of cells with Rad51 foci, as a function of the time of contact with hydroxyurea. At least 300 cells were counted per point. The names and phenotypes of the cell lines are indicated in the figure. X4C and X4V are two independent XR-1 deriving clones, complemented with the XRCC4 cDNA.
Fig. 8. NHEJ and homologous recombination on DSB induced by replication inhibitors. Replication arrest creates DSBs. In the early response, DSBs are mainly processed by NHEJ and homologous recombination is marginally involved. A defect in NHEJ leads to hypersensitivity to replication inhibitors. Prolonged arrest (late response) leads to the accumulation of DSBs. NHEJ would be overwhelmed and homologous recombination can act efficiently.
Similar articles
- Homologous recombination protects mammalian cells from replication-associated DNA double-strand breaks arising in response to methyl methanesulfonate.
Nikolova T, Ensminger M, Löbrich M, Kaina B. Nikolova T, et al. DNA Repair (Amst). 2010 Oct 5;9(10):1050-63. doi: 10.1016/j.dnarep.2010.07.005. Epub 2010 Aug 13. DNA Repair (Amst). 2010. PMID: 20708982 - XRCC4 in G1 suppresses homologous recombination in S/G2, in G1 checkpoint-defective cells.
Saintigny Y, Delacôte F, Boucher D, Averbeck D, Lopez BS. Saintigny Y, et al. Oncogene. 2007 Apr 26;26(19):2769-80. doi: 10.1038/sj.onc.1210075. Epub 2006 Oct 23. Oncogene. 2007. PMID: 17057732 - Non-homologous end joining is the responsible pathway for the repair of fludarabine-induced DNA double strand breaks in mammalian cells.
de Campos-Nebel M, Larripa I, González-Cid M. de Campos-Nebel M, et al. Mutat Res. 2008 Nov 10;646(1-2):8-16. doi: 10.1016/j.mrfmmm.2008.08.013. Epub 2008 Sep 4. Mutat Res. 2008. PMID: 18812179 - [DNA homologous recombination repair in mammalian cells].
Popławski T, Błasiak J. Popławski T, et al. Postepy Biochem. 2006;52(2):180-93. Postepy Biochem. 2006. PMID: 17078508 Review. Polish. - Differential usage of non-homologous end-joining and homologous recombination in double strand break repair.
Sonoda E, Hochegger H, Saberi A, Taniguchi Y, Takeda S. Sonoda E, et al. DNA Repair (Amst). 2006 Sep 8;5(9-10):1021-9. doi: 10.1016/j.dnarep.2006.05.022. Epub 2006 Jun 27. DNA Repair (Amst). 2006. PMID: 16807135 Review.
Cited by
- Reversible and effective cell cycle synchronization method for studying stage-specific investigations.
Chen YL, Reddy S, Suzuki A. Chen YL, et al. bioRxiv [Preprint]. 2024 Sep 3:2024.09.02.610832. doi: 10.1101/2024.09.02.610832. bioRxiv. 2024. PMID: 39282459 Free PMC article. Preprint. - Induction of homologous recombination by site-specific replication stress.
Triplett MK, Johnson MJ, Symington LS. Triplett MK, et al. DNA Repair (Amst). 2024 Oct;142:103753. doi: 10.1016/j.dnarep.2024.103753. Epub 2024 Aug 16. DNA Repair (Amst). 2024. PMID: 39190984 Review. - Intrinsic PARG inhibitor sensitivity is mimicked by TIMELESS haploinsufficiency and rescued by nucleoside supplementation.
Coulson-Gilmer C, Littler S, Barnes BM, Brady RM, Anagho HA, Pillay N, Dey M, Macmorland W, Bronder D, Nelson L, Tighe A, Lin WH, Morgan RD, Unwin RD, Nielsen ML, McGrail JC, Taylor SS. Coulson-Gilmer C, et al. NAR Cancer. 2024 Jul 16;6(3):zcae030. doi: 10.1093/narcan/zcae030. eCollection 2024 Sep. NAR Cancer. 2024. PMID: 39015544 Free PMC article. - Polyadenosine diphosphate-ribose polymerase inhibitors: advances, implications, and challenges in tumor radiotherapy sensitization.
Zhang Y, Liang L, Li Z, Huang Y, Jiang M, Zou B, Xu Y. Zhang Y, et al. Front Oncol. 2023 Dec 4;13:1295579. doi: 10.3389/fonc.2023.1295579. eCollection 2023. Front Oncol. 2023. PMID: 38111536 Free PMC article. Review. - Genome instability footprint under rapamycin and hydroxyurea treatments.
Li J, Stenberg S, Yue JX, Mikhalev E, Thompson D, Warringer J, Liti G. Li J, et al. PLoS Genet. 2023 Nov 6;19(11):e1011012. doi: 10.1371/journal.pgen.1011012. eCollection 2023 Nov. PLoS Genet. 2023. PMID: 37931001 Free PMC article.
References
- Ausubel F., Brent,R., Kingston,R., Moore,D., Seidman,J., Smith,J. and Struhl,K. (1999) Current Protocols in Molecular Biology. Vols 1–4. John Wiley & Sons, Inc., Boston, MA.
- Caligo M.A., Piras,A. and Rainaldi,G. (1988) Time course of sister chromatid exchanges and gene amplification induced by 1-β-d-arabinofuranosylcytosine in V79-AP4 Chinese hamster cells. Chromosoma, 96, 306–310. - PubMed
- Chen F., Nastasi,A., Shen,Z., Brenneman,M., Crissman,H. and Chen,D.J. (1997) Cell cycle-dependent protein expression of mammalian homologs of yeast DNA double-strand break repair genes Rad51 and Rad52. Mutat. Res., 384, 205–211. - PubMed
- Cox M.M., Goodman,M.F., Kreuzer,K.N., Sherratt,D.J., Sandler,S.J. and Marians,K.J. (2000) The importance of repairing stalled replication forks. Nature, 404, 37–41. - PubMed
Publication types
MeSH terms
Substances
LinkOut - more resources
Full Text Sources
Other Literature Sources
Research Materials


