Activation of expressed KCNQ potassium currents and native neuronal M-type potassium currents by the anti-convulsant drug retigabine - PubMed (original) (raw)
Activation of expressed KCNQ potassium currents and native neuronal M-type potassium currents by the anti-convulsant drug retigabine
L Tatulian et al. J Neurosci. 2001.
Abstract
Retigabine [D-23129; N-(2-amino-4-(4-fluorobenzylamino)-phenyl) carbamic acid ethyl ester] is a novel anticonvulsant compound that is now in clinical phase II development. It has previously been shown to enhance currents generated by KCNQ2/3 K(+) channels when expressed in Chinese hamster ovary (CHO) cells (Main et al., 2000; Wickenden et al., 2000). In the present study, we have compared the actions of retigabine on KCNQ2/3 currents with those on currents generated by other members of the KCNQ family (homomeric KCNQ1, KCNQ2, KCNQ3, and KCNQ4 channels) expressed in CHO cells and on the native M current in rat sympathetic neurons [thought to be generated by KCNQ2/3 channels (Wang et al., 1998)]. Retigabine produced a hyperpolarizing shift of the activation curves for KCNQ2/3, KCNQ2, KCNQ3, and KCNQ4 currents with differential potencies in the following order: KCNQ3 > KCNQ2/3 > KCNQ2 > KCNQ4, as measured either by the maximum hyperpolarizing shift in the activation curves or by the EC(50) values. In contrast, retigabine did not enhance cardiac KCNQ1 currents. Retigabine also produced a hyperpolarizing shift in the activation curve for native M channels in rat sympathetic neurons. The retigabine-induced current was inhibited by muscarinic receptor stimulation, with similar agonist potency but 25% reduced maximum effect. In unclamped neurons, retigabine produced a hyperpolarization and reduced the number of action potentials produced by depolarizing current injections, without change in action potential configuration.
Figures
Fig. 1.
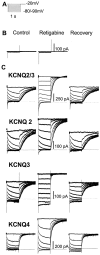
Enhancement of heteromeric (KCNQ2/3) and homomeric (KCNQ2–4) currents in CHO cells by retigabine. A, Voltage protocol: currents were activated by clamping the membrane at −20 mV and then deactivated by 1 sec hyperpolarizations to −90 mV in 10 mV increments. B, Retigabine (10 μ
m
) did not activate any endogenous currents in untransfected CHO cells.C, KCNQ currents generated by the voltage protocol in_A_ recorded in the absence (left), presence (center), and 10 min after washout (right) of retigabine. _Dotted lines_denote zero current level.
Fig. 2.
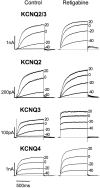
Activation of heteromeric KCNQ2/3 and homomeric KCNQ2–4 channels expressed in CHO cells in the absence and presence of retigabine. Families of KCNQ currents were recorded in the absence (left) or presence (right) of 10 μ
m
retigabine. Currents were activated by 1 sec depolarizing pulses in 10 mV increments to +50 mV from a holding potential of −70 mV. Records show currents recorded at −40, −20, 0, and +20 mV. Note that KCNQ3 and KCNQ4, but not KCNQ2/3 and KCNQ2 currents, are increased at all voltages by retigabine.
Fig. 3.
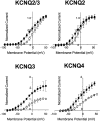
Effects of retigabine on the KCNQ2–4 current–voltage relationship. Normalized current values were plotted against command potential before (○) and after (●) addition of 10 μ
m
retigabine. To obtain normalized values, peak current amplitudes in response to depolarizing pulses from a holding voltage of −70 to +50 mV in 10 mV increments were normalized against the maximum current amplitude at +50 mV in control recordings. Retigabine shifts the threshold for channel activation and augments KCNQ current amplitude across a range of membrane potentials.
Fig. 4.
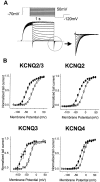
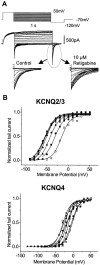
Effects of retigabine on the KCNQ2–4 activation curves. A, Currents were activated by depolarizing pulses to +50 mV from a holding potential of −70 mV and deactivated by 1 sec hyperpolarizing pulses to various potentials between +50 and −120 mV, followed by a step to −120 mV. The_inset_ shows the tail currents recorded at −120 mV, which were used to construct the activation curves. B, Activation curves in the absence (○) and presence (●) of retigabine were obtained from tail currents as described in Materials and Methods and fitted with the Boltzmann Equation 1. The_V_1/2 values were as follows: KCNQ2/3, −17.3 ± 2.2 mV for control (n = 9) and −47.7 ± 2.7 mV for retigabine-treated cells (n = 9); KCNQ2, −11.5 ± 1.5 mV for control (n = 16) and −35.7 ± 2.1 mV for retigabine-treated cells (n = 6); KCNQ3, −28.7 ± 2.5 mV for control (n = 7) and −71.5 ± 3.1 mV for retigabine-treated cells (n = 7); and KCNQ4, −12.6 ± 0.7 mV for control (n = 4) and −26.2 ± 0.6 mV for retigabine-treated cells (n = 4). Slopes were as follows: KCNQ2/3, 12.9 ± 1.2 mV (control, n = 9) and 11.4 ± 1.3 mV (retigabine, n = 5); KCNQ2, 10.9 ± 0.6 mV (control, n = 16) and 11.2 ± 0.9 mV (retigabine, n = 6); KCNQ3, 11.4 ± 0.9 mV (control, n = 7) and 10.9 ± 0.9 mV (retigabine, n = 7); and KCNQ4, 10.1 ± 0.3 mV (control, n = 4) and 12.1 ± 1.6 mV (retigabine, n = 4). The data shown are mean ± SEM.
Fig. 5.
Effects of retigabine on KCNQ currents are concentration dependent. A, Experiments were performed in high extracellular K+ (25 m
m
) solution to enhance the tail currents. A family of currents for KCNQ2/3 and the voltage protocol under these conditions are shown. Application of retigabine led to a slowing in the rate of decline of the KCNQ tail current (inset). B, Representative activation curves for KCNQ2/3 and KCNQ4 generated in the absence (■) and presence of 1 μ
m
(▪), 3 μ
m
(▴), 10 μ
m
(●), 30 μ
m
(▾), 100 μ
m
(♦), and 300 μ
m
(✳) retigabine. For KCNQ4, 1 m
m
retigabine (⋄) was also applied.
Fig. 6.
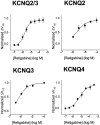
Concentration–response curves for KCNQ2/3, KCNQ2, KCNQ3, and KCNQ4. The magnitude of the leftward shift in the half-activation potential (_V_1/2) was calculated with each concentration of retigabine and normalized against the maximum shift. The maximum shift in the activation curve was obtained with 10 μ
m
retigabine for KCNQ2/3, KCNQ2, and KCNQ3 and with 300 μ
m
for KCNQ4. Normalized values were plotted against retigabine concentration, and the data were fitted with Equation 2 with the following parameters: EC50 = 1.9 ± 0.2 μ
m
and slope = 1.3 ± 0.2 for KCNQ2/3 (n = 5); EC50 = 2.5 ± 0.6 μ
m
and slope = 1.1 ± 0.5 for KCNQ2 (n = 5); EC50 = 0.6 ± 0.3 μ
m
and slope = 1.2 ± 0.4 for KCNQ3 (n = 3); and EC50 = 5.2 ± 0.9 μ
m
and slope = 0.9 ± 0.2 for KCNQ4 (n = 3). Each point represents the mean ± SEM.
Fig. 7.
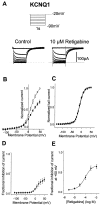
Retigabine does not enhance KCNQ1 current in CHO cells. A, KCNQ1 currents were recorded using the protocol shown in inset in the absence (left) and presence (right) of 10 μ
m
retigabine. B, Normalized current–voltage curve for KCNQ1 in the absence (○) and presence (●) of 100 μ
m
retigabine. Voltage protocol as in Figure2. Note the reduction of peak current in the presence of retigabine.C, Activation curves were constructed for KCNQ1 in the absence (○, n = 11) and presence (●,n = 5) of 100 μ
m
retigabine as described in Figure 4. Lines are Boltzmann fits to the data, giving_V_1/2 = −12.5 ± 1.1 mV and slope of 12.4 ± 0.9 mV for control and_V_1/2 = −13.2 ± 1.2 mV and slope of 12.4 ± 0.9 mV in the presence of retigabine._V_1/2 values are not significantly different (unpaired t test; p = 0.7).D, Voltage dependence of inhibition: fraction of current inhibited by 100 μ
m
retigabine plotted against voltage (replotted from B). E, Concentration dependence of inhibition. Fractional inhibition at +50 mV (ordinate) was plotted against log M retigabine concentration (abscissa). Data were fitted with Equation2 (see Materials and Methods). Points show means ± SEM, with_n_ = 4. Mean IC50 was 100.1 ± 6.5 μ
m
, and the slope was 1.26 ± 0.16.
Fig. 8.
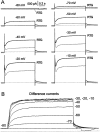
Retigabine enhances outward currents in SCG neurons. A, Families of currents recorded from a rat SCG neuron elicited by 1 sec voltage steps from a holding potential of −80 mV to test potentials from −70 to −10 mV (as indicated). Retigabine (RTG) was applied via bath perfusion at 10 μ
m
. b, Retigabine-induced outward currents obtained by subtracting control currents from currents in the presence of retigabine. Note the saturation of the current at potentials positive to −30 mV.
Fig. 9.
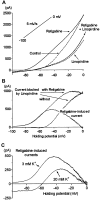
Retigabine shifts the voltage dependence of activation of the M current. A, Superimposed steady-state I_–_V relationships (determined using a voltage ramp from −100 to 0 mV at 5 mV/sec) from a single cell in control conditions and after addition of linopirdine (10 μ
m
), retigabine (10 μ
m
, after washout of linopirdine), and retigabine + linopirdine. B, Difference currents obtained by digitally subtracting the_I_–V relationships shown in_A_. Note the leftward shift in the activation of the M current (linopirdine-sensitive current) induced by retigabine and the bell shape of the retigabine induced current. C, Retigabine-induced current in the presence of 3 and 20 m
m
external K+. Calculated_E_K values were −102 and −56 mV, respectively.
Fig. 10.
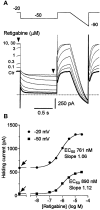
Modulation of the M current by retigabine is concentration dependent. A, Superimposed M-current traces before and after cumulative addition of retigabine (0.1–30 μ
m
). The M current was recorded in response to 1 sec hyperpolarizing steps from a holding potential of −20 to −50 mV followed by a ramp to −90 mV. Note that the increase in holding current is associated with alteration of M-current deactivation relaxation. B, Holding current at −50 and −20 mV plotted against retigabine concentrations for the cell illustrated in_A_. Solid lines represent best fits to the Hill equation with holding currents in the absence of retigabine of 610 pA at −20 mV and 42 pA at −50 mV (as indicated by_arrows_). EC50 values and Hill coefficient (slope) are indicated. Mean values are given in Results.
Fig. 11.
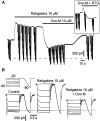
Muscarinic inhibition of retigabine-enhanced M current. A, Currents were produced by holding at −20 mV and giving repeated steps to −80 mV in 10 mV increments. Steady-state currents were enhanced by retigabine (RTG) and inhibited by oxotremorine-M (Oxo-M). The_inset_ shows currents induced by the simultaneous application of retigabine and Oxo-M. B, Families of M-current deactivations obtained before (Control) and after addition of retigabine (10 μ
m
) and retigabine (10 μ
m
) + Oxo-M (10 μ
m
).
Fig. 12.
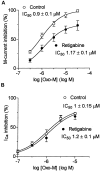
Retigabine-enhanced M currents are more resistant to modulation. A, Concentration dependence of M-current inhibition by Oxo-M in the presence (●) or absence (○) of retigabine (10 μ
m
). B, Concentration dependence of Ca2+ current inhibition by Oxo-M in the presence (●) or absence (○) of retigabine (10 μ
m
). Ca2+ currents were recorded using the perforated-patch method in cells pretreated with pertussis toxin (0.5 μg/μl) for 24 hr (Delmas et al., 1998a). Points were fitted with Equation 2 (see Materials and Methods).
Fig. 13.
Retigabine abolishes firing in SCG neurons. Voltage responses to depolarizing and hyperpolarizing current pulses recorded from an SCG neuron before (A) and during the application of retigabine (RTG; 3 μ
m
) (B, C). Note in C that larger depolarizing current pulses are required to evoke an action potential in the presence of retigabine. D, Action potential evoked by a 1 msec/700 pA depolarizing pulse in the presence (thick line) and absence (thin line) of retigabine (3 μ
m
).
Similar articles
- Retigabine, a novel anti-convulsant, enhances activation of KCNQ2/Q3 potassium channels.
Wickenden AD, Yu W, Zou A, Jegla T, Wagoner PK. Wickenden AD, et al. Mol Pharmacol. 2000 Sep;58(3):591-600. doi: 10.1124/mol.58.3.591. Mol Pharmacol. 2000. PMID: 10953053 - Modulation of KCNQ2/3 potassium channels by the novel anticonvulsant retigabine.
Main MJ, Cryan JE, Dupere JR, Cox B, Clare JJ, Burbidge SA. Main MJ, et al. Mol Pharmacol. 2000 Aug;58(2):253-62. doi: 10.1124/mol.58.2.253. Mol Pharmacol. 2000. PMID: 10908292 - Inhibition of KCNQ1-4 potassium channels expressed in mammalian cells via M1 muscarinic acetylcholine receptors.
Selyanko AA, Hadley JK, Wood IC, Abogadie FC, Jentsch TJ, Brown DA. Selyanko AA, et al. J Physiol. 2000 Feb 1;522 Pt 3(Pt 3):349-55. doi: 10.1111/j.1469-7793.2000.t01-2-00349.x. J Physiol. 2000. PMID: 10713961 Free PMC article. - Potassium channels: how genetic studies of epileptic syndromes open paths to new therapeutic targets and drugs.
Cooper EC. Cooper EC. Epilepsia. 2001;42 Suppl 5:49-54. doi: 10.1046/j.1528-1157.2001.0420s5049.x. Epilepsia. 2001. PMID: 11887968 Review. - The mechanism of action of retigabine (ezogabine), a first-in-class K+ channel opener for the treatment of epilepsy.
Gunthorpe MJ, Large CH, Sankar R. Gunthorpe MJ, et al. Epilepsia. 2012 Mar;53(3):412-24. doi: 10.1111/j.1528-1167.2011.03365.x. Epub 2012 Jan 5. Epilepsia. 2012. PMID: 22220513 Review.
Cited by
- Contribution of near-threshold currents to intrinsic oscillatory activity in rat medial entorhinal cortex layer II stellate cells.
Boehlen A, Henneberger C, Heinemann U, Erchova I. Boehlen A, et al. J Neurophysiol. 2013 Jan;109(2):445-63. doi: 10.1152/jn.00743.2011. Epub 2012 Oct 17. J Neurophysiol. 2013. PMID: 23076110 Free PMC article. - Pharmacological Manipulation of K v 7 Channels as a New Therapeutic Tool for Multiple Brain Disorders.
Vigil FA, Carver CM, Shapiro MS. Vigil FA, et al. Front Physiol. 2020 Jun 19;11:688. doi: 10.3389/fphys.2020.00688. eCollection 2020. Front Physiol. 2020. PMID: 32636759 Free PMC article. Review. - Kv7 Channels and Excitability Disorders.
Jones F, Gamper N, Gao H. Jones F, et al. Handb Exp Pharmacol. 2021;267:185-230. doi: 10.1007/164_2021_457. Handb Exp Pharmacol. 2021. PMID: 33860384 - Kv7/M-type potassium channels in rat skin keratinocytes.
Reilly JM, Telezhkin V, Passmore GM, Marsh SJ, Brown DA. Reilly JM, et al. Pflugers Arch. 2013 Sep;465(9):1371-81. doi: 10.1007/s00424-013-1276-2. Epub 2013 Apr 17. Pflugers Arch. 2013. PMID: 23592175 Free PMC article. - M-channels (Kv7/KCNQ channels) that regulate synaptic integration, excitability, and spike pattern of CA1 pyramidal cells are located in the perisomatic region.
Hu H, Vervaeke K, Storm JF. Hu H, et al. J Neurosci. 2007 Feb 21;27(8):1853-67. doi: 10.1523/JNEUROSCI.4463-06.2007. J Neurosci. 2007. PMID: 17314282 Free PMC article.
References
- Barhanin J, Lesage F, Guillemare E, Fink M, Lazdunski M, Romey G. KvLQT1 and lsK (minK) proteins associate to form the IKs cardiac potassium current. Nature. 1996;384:78–80. - PubMed
- Biervert C, Schroeder BC, Kubisch C, Berkovic SF, Propping P, Jentsch T, Steinlein OK. A potassium channel mutation in neonatal human epilepsy. Science. 1998;279:403–406. - PubMed
- Brown DA. M-currents. In: Narahashi T, editor. Ion channels, Vol 1. Plenum; New York: 1988. pp. 55–99. - PubMed
Publication types
MeSH terms
Substances
LinkOut - more resources
Full Text Sources
Other Literature Sources
Molecular Biology Databases
