Firing rates of hippocampal neurons are preserved during subsequent sleep episodes and modified by novel awake experience - PubMed (original) (raw)
Firing rates of hippocampal neurons are preserved during subsequent sleep episodes and modified by novel awake experience
H Hirase et al. Proc Natl Acad Sci U S A. 2001.
Abstract
What determines the firing rate of cortical neurons in the absence of external sensory input or motor behavior, such as during sleep? Here we report that, in a familiar environment, the discharge frequency of simultaneously recorded individual CA1 pyramidal neurons and the coactivation of cell pairs remain highly correlated across sleep-wake-sleep sequences. However, both measures were affected when new sets of neurons were activated in a novel environment. Nevertheless, the grand mean firing rate of the whole pyramidal cell population remained constant across behavioral states and testing conditions. The findings suggest that long-term firing patterns of single cells can be modified by experience. We hypothesize that increased firing rates of recently used neurons are associated with a concomitant decrease in the discharge activity of the remaining population, leaving the mean excitability of the hippocampal network unaltered.
Figures
Figure 1
Ensemble activity of CA1 pyramidal cells (pyr; n = 30) and putative interneurons (int; n = 7) in the running-wheel task. Other recorded neurons with <0.1-Hz firing rates are not shown. (_Top_) Continuous display of spectral power during run–drink–run transitions. Note high theta power (7 Hz) during running (red band). (_Middle_) Spike times of individual cells and the output of the odometer. Continuous slope reflects steady running. Neurons with in-wheel firing-rate ratios >2 were termed “wheel” cells (e.g., neuron 2; green). (Bottom) The rectangle portion on the left part of the firing map represents the wheel and the large square represents the box area. Three more neurons with place fields in the box area (red, blue, and magenta) are also shown. Neurons 1 and 3 illustrate overlapping place fields while the rat was approaching the water spout, whereas neurons 3 and 4 illustrate nonoverlapping fields (13). Several other pyramidal cells showed place fields in either the wheel or the box area (not shown).
Figure 2
Short-term (<30 min) comparison of discharge frequency of individual pyramidal cells during different behavioral states. (Left) Relationship between firing rates of wheel cells and non-wheel cells during running in wheel and walking in box (theta behaviors) and drinking/immobility (non-theta). (Right) Relationship between firing rates during REM and SWS. The high correlation of firing rates across different stages of sleep indicates that similar cell assemblies are being activated in both SWS and REM sleep.
Figure 3
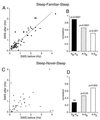
Comparison of discharge frequency of pyramidal cells in two successive SWS episodes, interrupted by either a wheel-running session (A, familiar) or novel exploration (C, novel). Wheel cells (filled gray circles) are shown separately in A. (B and D) Mean correlation values for sleep before vs. sleep after (SB-SA), awake vs. sleep before (A-SB), and awake vs. sleep after (A-SA) sessions in the well trained running-wheel task (B) and in the novel environment (D). Note high and low correlations between successive sleep sessions in the familiar and novel environments, respectively.
Figure 4
Mean population firing rates (±SE) in awake and sleep states in the running-wheel task (familiar) and novel environment. None of the comparisons are significantly different.
Figure 5
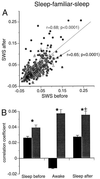
Comparison between pairwise correlations of pyramidal cells recorded during SWS before and SWS after a wheel-running session. Each data point in A corresponds to one cell pair. Pairs with high (>0.05) and low (<0.05) correlations in the awake state are shown by filled red circles and open triangles, respectively. (B) Mean cross-correlation (±50 msec) for neuron pairs during sleep before and after wheel running (awake). Data are shown separately for neuron pairs with high (red) and low (black) awake correlation. Neuron pairs with high and low awake correlations were significantly different in both sleep sessions (*, P < 0.01). The sleep before vs. sleep after comparison was also significant (+, P < 0.05) for cell pairs with high awake correlation.
Similar articles
- Influences of hippocampal place cell firing in the awake state on the activity of these cells during subsequent sleep episodes.
Pavlides C, Winson J. Pavlides C, et al. J Neurosci. 1989 Aug;9(8):2907-18. doi: 10.1523/JNEUROSCI.09-08-02907.1989. J Neurosci. 1989. PMID: 2769370 Free PMC article. - Regulation of Hippocampal Firing by Network Oscillations during Sleep.
Miyawaki H, Diba K. Miyawaki H, et al. Curr Biol. 2016 Apr 4;26(7):893-902. doi: 10.1016/j.cub.2016.02.024. Epub 2016 Mar 10. Curr Biol. 2016. PMID: 26972321 Free PMC article. - Single-cell activity and synchronous bursting in the rat hippocampus during waking behavior and sleep.
Suzuki SS, Smith GK. Suzuki SS, et al. Exp Neurol. 1985 Jul;89(1):71-89. doi: 10.1016/0014-4886(85)90266-3. Exp Neurol. 1985. PMID: 4007117 - Neuronal models for sleep-wake regulation and synaptic reorganization in the sleeping hippocampus.
Best J, Diniz Behn C, Poe GR, Booth V. Best J, et al. J Biol Rhythms. 2007 Jun;22(3):220-32. doi: 10.1177/0748730407301239. J Biol Rhythms. 2007. PMID: 17517912 Review. - In vivo approach to the cellular mechanisms for sensory processing in sleep and wakefulness.
Velluti RA, Pedemonte M. Velluti RA, et al. Cell Mol Neurobiol. 2002 Dec;22(5-6):501-16. doi: 10.1023/a:1021956401616. Cell Mol Neurobiol. 2002. PMID: 12585677 Review.
Cited by
- The balance of forward and backward hippocampal sequences shifts across behavioral states.
Wikenheiser AM, Redish AD. Wikenheiser AM, et al. Hippocampus. 2013 Jan;23(1):22-9. doi: 10.1002/hipo.22049. Epub 2012 Jun 27. Hippocampus. 2013. PMID: 22736562 Free PMC article. - About sleep's role in memory.
Rasch B, Born J. Rasch B, et al. Physiol Rev. 2013 Apr;93(2):681-766. doi: 10.1152/physrev.00032.2012. Physiol Rev. 2013. PMID: 23589831 Free PMC article. Review. - Discriminating Sleep From Freezing With Cortical Spindle Oscillations.
Pompili MN, Todorova R. Pompili MN, et al. Front Neural Circuits. 2022 Mar 24;16:783768. doi: 10.3389/fncir.2022.783768. eCollection 2022. Front Neural Circuits. 2022. PMID: 35399613 Free PMC article. - Frequency matters: how changes in hippocampal theta frequency can influence temporal coding, anxiety-reduction, and memory.
Hines M, Poulter S, Douchamps V, Pibiri F, McGregor A, Lever C. Hines M, et al. Front Syst Neurosci. 2023 Feb 3;16:998116. doi: 10.3389/fnsys.2022.998116. eCollection 2022. Front Syst Neurosci. 2023. PMID: 36817946 Free PMC article. - Reverberation, storage, and postsynaptic propagation of memories during sleep.
Ribeiro S, Nicolelis MA. Ribeiro S, et al. Learn Mem. 2004 Nov-Dec;11(6):686-96. doi: 10.1101/lm.75604. Learn Mem. 2004. PMID: 15576886 Free PMC article. Review.
References
- Turrigiano G G, Leslie K R, Desai N S, Rutherford L C, Nelson S B. Nature (London) 1998;391:892–896. - PubMed
- Squire L R, Alvarez P. Curr Opin Neurobiol. 1995;2:169–177. - PubMed
- Eichenbaum H. Behav Brain Res. 1999;103:123–133. - PubMed
- Marr D. Philos Trans R Soc London B. 1971;262:23–81. - PubMed
- Buzsáki G. Neuroscience. 1989;31:551–570. - PubMed
Publication types
MeSH terms
LinkOut - more resources
Full Text Sources
Miscellaneous


