Epstein-Barr virus latent membrane protein 2A (LMP2A) employs the SLP-65 signaling module - PubMed (original) (raw)
Epstein-Barr virus latent membrane protein 2A (LMP2A) employs the SLP-65 signaling module
N Engels et al. J Exp Med. 2001.
Abstract
In latently infected B lymphocytes, the Epstein-Barr virus (EBV) suppresses signal transduction from the antigen receptor through expression of the integral latent membrane protein 2A (LMP2A). At the same time, LMP2A triggers B cell survival by a yet uncharacterized maintenance signal that is normally provided by the antigen receptor. The molecular mechanisms are unknown as LMP2A-regulated signaling cascades have not been described so far. Using a novel mouse model we have identified the intracellular adaptor protein Src homology 2 (SH2) domain-containing leukocyte protein (SLP)-65 as a critical downstream effector of LMP2A in vivo. Biochemical analysis of the underlying signaling pathways revealed that EBV infection causes constitutive tyrosine phosphorylation of one of the two SLP-65 isoforms and complex formation between SLP-65 and the protooncoprotein CrkL (CT10 regulator of kinase like). This leads to antigen receptor-independent phosphorylation of Cbl (Casitas B lineage lymphoma) and C3G. In contrast, phospholipase C-gamma2 (PLC-gamma2) activation is completely blocked. Our data show that in order to establish a latent EBV infection, LMP2A selectively activates or represses SLP-65-regulated signaling pathways.
Figures
Figure 1
Loss of the LMP2A developmental and survival phenotype when bred into the SLP-65−/− background. (A) Mouse splenocytes (SP) and (B) bone marrow samples (BM) from WT, TgE SLP-65−/−, and TgE SLP-65−/− animals were subjected to flow cytometric analysis with at least 10,000 gated lymphocytes collected per animal using CD19-PE (CD19) and IgM-FITC (IgM) antibodies. Typical dot plot results of 10,000 gated lymphocytes from 5–7-wk-old animals (n = 5) are shown. The polygons represent distinct subpopulations of B cells with the average percentage of total gated lymphocytes indicated above each polygon. (A) The left polygon represents CD19+IgM− B cells typical in TgE animals; the right polygon represents CD19+IgM+ cells. (B) The left rectangle represents CD19+IgM− B cells; the right rectangle represents CD19+IgM+ B cells.
Figure 2
Impaired BCR signaling but elevated levels of pTyr-containing proteins in EBV-infected B cells. Two independently obtained LCLs (lanes 1–4 in panel a and 1–6 in panel b) and EBV-negative Ramos B cells (lanes 5 and 6 in panel a and 7–9 in panel b_)_ were left untreated or stimulated through their BCR with F(ab′)2 fragments of anti-IgM antibodies for the indicated time points (30 s or 3 min). (a) From the cleared cellular lysates, phosphoproteins were isolated by affinity purification (AP) with a GST fusion protein encompassing the tandem SH2 domains of Syk (GST-SYK[SH2]2) and detected by anti-pTyr immunoblotting. (b) Lysates were subjected to immunoprecipitation (IP) with anti-pTyr antibodies and the material was analyzed by subsequent immunoblotting with antibodies to pTyr (top panel), Syk (middle panel), and SLP-65 (bottom panel). (c) Cellular lysates of the different LCLs used in this study (lanes 1–4) and Ramos B cells (lane 5) were immunoblotted with anti–SLP-65 antibodies. Relative molecular masses of marker proteins are indicated on the left in kD.
Figure 4
Syk and SLP-65 associate in vivo_._ Anti–SLP-65 immunoprecipitates from unstimulated and BCR-stimulated LCLs (lanes 1–4) or Ramos B cells (lanes 5 and 6) were analyzed by anti-Syk immunoblotting. Relative molecular mass of marker protein is indicated on the left in kD. Note that a constitutive Syk/SLP-65 complex formation was observed in all LCLs that have been investigated (n = 4), but some variability in the amount of Syk present in SLP-65 immunoprecipitates was observed (compare lanes 1 and 4).
Figure 3
Constitutive tyrosine phosphorylation of the p70 isoform of SLP-65 in EBV-infected B cells. Two independent LCL clones (lanes 1–4) and Ramos B cells (lanes 5 and 6) were left untreated (lanes 1, 3, and 5) or stimulated through their BCR for 3 min (lanes 2, 4, and 6). From the cleared lysates of these cells, anti–SLP-65 immunoprecipitates (IP) were prepared and analyzed by anti-pTyr immunoblotting. Relative molecular mass of marker protein is indicated on the left in kD.
Figure 5
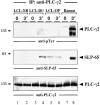
Block of PLC-γ2 phosphorylation in LCLs. Anti–PLC-γ2 immunoprecipitates from unstimulated and BCR-stimulated LCLs (lanes 1–6) or Ramos B cells (lanes 7 and 8) were analyzed by immunoblotting with antibodies to pTyr (top panel), SLP-65 (middle panel), or PLC-γ2 (bottom panel). Relative molecular masses of marker proteins are indicated on the left in kD.
Figure 6
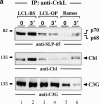
Association of the protooncoprotein CrkL with SLP-65. (a) Anti-CrkL immunoprecipitates (IP) were prepared from cleared cellular lysates of untreated or BCR-stimulated LCLs (lanes 1–4) and Ramos B cells (lanes 5 and 6), and analyzed by subsequent immunoblotting with antibodies to SLP-65 (top panel), Cbl (middle panel), and C3G (bottom panel). (b) Anti-pTyr immunoprecipitates from the same cells were analyzed by anti-CrkL or anti-C3G immunoblotting (top and bottom panel, respectively). Relative molecular masses of marker proteins are indicated on the left in kD.
Figure 7
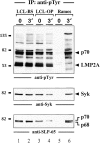
EBV-positive B cells are unresponsive to treatment with pervanadate/H2O2. Two independent LCL clones (lanes 1–4) and Ramos B cells (lanes 5 and 6) were left untreated (lanes 1, 3, and 5) or incubated with 20 μM pervanadate/H2O2 for 3 min at 37°C (lanes 2, 4, and 6). From the cleared cellular lysates, tyrosine-phosphorylated proteins were purified by immunoprecipitation (IP) and analyzed by subsequent immunoblotting with antibodies to pTyr (top panel), Syk (middle panel), and SLP-65 (bottom panel). Relative molecular masses of marker proteins are indicated on the left in kD.
Similar articles
- Epstein-Barr Virus Latent Membrane Protein 2A (LMP2A) enhances IL-10 production through the activation of Bruton's tyrosine kinase and STAT3.
Incrocci R, Barse L, Stone A, Vagvala S, Montesano M, Subramaniam V, Swanson-Mungerson M. Incrocci R, et al. Virology. 2017 Jan;500:96-102. doi: 10.1016/j.virol.2016.10.015. Epub 2016 Oct 25. Virology. 2017. PMID: 27792904 Free PMC article. - Inhibition of host kinase activity altered by the LMP2A signalosome-a therapeutic target for Epstein-Barr virus latency and associated disease.
Cooper L, Longnecker R. Cooper L, et al. Antiviral Res. 2002 Dec;56(3):219-31. doi: 10.1016/s0166-3542(02)00110-9. Antiviral Res. 2002. PMID: 12406506 - Latent membrane protein 2A of Epstein-Barr virus binds WW domain E3 protein-ubiquitin ligases that ubiquitinate B-cell tyrosine kinases.
Winberg G, Matskova L, Chen F, Plant P, Rotin D, Gish G, Ingham R, Ernberg I, Pawson T. Winberg G, et al. Mol Cell Biol. 2000 Nov;20(22):8526-35. doi: 10.1128/MCB.20.22.8526-8535.2000. Mol Cell Biol. 2000. PMID: 11046148 Free PMC article. - Latent Membrane Protein 2 (LMP2).
Cen O, Longnecker R. Cen O, et al. Curr Top Microbiol Immunol. 2015;391:151-80. doi: 10.1007/978-3-319-22834-1_5. Curr Top Microbiol Immunol. 2015. PMID: 26428374 Review. - The LMP2A signalosome--a therapeutic target for Epstein-Barr virus latency and associated disease.
Portis T, Cooper L, Dennis P, Longnecker R. Portis T, et al. Front Biosci. 2002 Feb 1;7:d414-26. doi: 10.2741/portis. Front Biosci. 2002. PMID: 11815296 Review.
Cited by
- K1 and K15 of Kaposi's Sarcoma-Associated Herpesvirus Are Partial Functional Homologues of Latent Membrane Protein 2A of Epstein-Barr Virus.
Steinbrück L, Gustems M, Medele S, Schulz TF, Lutter D, Hammerschmidt W. Steinbrück L, et al. J Virol. 2015 Jul;89(14):7248-61. doi: 10.1128/JVI.00839-15. Epub 2015 May 6. J Virol. 2015. PMID: 25948739 Free PMC article. - The c-Cbl proto-oncoprotein downregulates EBV LMP2A signaling.
Ikeda M, Longnecker R. Ikeda M, et al. Virology. 2009 Mar 1;385(1):183-91. doi: 10.1016/j.virol.2008.11.018. Epub 2008 Dec 10. Virology. 2009. PMID: 19081591 Free PMC article. - Epstein-Barr virus in Burkitt's lymphoma: a role for latent membrane protein 2A.
Bieging KT, Swanson-Mungerson M, Amick AC, Longnecker R. Bieging KT, et al. Cell Cycle. 2010 Mar 1;9(5):901-8. doi: 10.4161/cc.9.5.10840. Epub 2010 Mar 3. Cell Cycle. 2010. PMID: 20160479 Free PMC article. - Itchy, a Nedd4 ubiquitin ligase, downregulates latent membrane protein 2A activity in B-cell signaling.
Ikeda A, Caldwell RG, Longnecker R, Ikeda M. Ikeda A, et al. J Virol. 2003 May;77(9):5529-34. doi: 10.1128/jvi.77.9.5529-5534.2003. J Virol. 2003. PMID: 12692257 Free PMC article. - E3 Ubiquitin Ligases in Gammaherpesviruses and HIV: A Review of Virus Adaptation and Exploitation.
Oswald J, Constantine M, Adegbuyi A, Omorogbe E, Dellomo AJ, Ehrlich ES. Oswald J, et al. Viruses. 2023 Sep 15;15(9):1935. doi: 10.3390/v15091935. Viruses. 2023. PMID: 37766341 Free PMC article. Review.
References
- Rickinson A.B., Kieff E. Epstein-Barr viruses. In: Fields B.N., Knipe D.M., Howely P.M., editors. Fields Virology. Lippincott-Raven; Philadelphia, PA: 1996. pp. 2397–2446.
- Longnecker R. Molecular biology of Epstein-Barr virus. In: McCane D., editor. Human Tumor Viruses. American Society for Microbiology; Washington, D.C.: 1998. pp. 133–172.
- Kieff E. Epstein-Barr virus and its replication. In: Fields B.N., Knipe D.M., Howley P.M., editors. Fundamental Virology. Lippincott-Raven; Philadelphia, PA: 1996. pp. 1009–1162.
Publication types
MeSH terms
Substances
Grants and funding
- CA62234/CA/NCI NIH HHS/United States
- R01 CA073507/CA/NCI NIH HHS/United States
- CA73507/CA/NCI NIH HHS/United States
- DE13127/DE/NIDCR NIH HHS/United States
- R01 CA062234/CA/NCI NIH HHS/United States
- R01 DE013127/DE/NIDCR NIH HHS/United States
LinkOut - more resources
Full Text Sources
Molecular Biology Databases
Miscellaneous


