Mutualism versus independence: strategies of mixed-species oral biofilms in vitro using saliva as the sole nutrient source - PubMed (original) (raw)
Mutualism versus independence: strategies of mixed-species oral biofilms in vitro using saliva as the sole nutrient source
R J Palmer Jr et al. Infect Immun. 2001 Sep.
Abstract
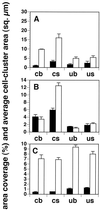
During initial dental plaque formation, the ability of a species to grow when others cannot would be advantageous, and enhanced growth through interspecies and intergeneric cooperation could be critical. These characteristics were investigated in three coaggregating early colonizers of the tooth surface (Streptococcus gordonii DL1, Streptococcus oralis 34, and Actinomyces naeslundii T14V). Area coverage and cell cluster size measurements showed that attachment of A. naeslundii and of S. gordonii to glass flowcells was enhanced by a salivary conditioning film, whereas attachment of S. oralis was hindered. Growth experiments using saliva as the sole carbon and nitrogen source showed that A. naeslundii was unable to grow either in planktonic culture or as a biofilm, whereas S. gordonii grew under both conditions. S. oralis grew planktonically, but to a much lower maximum cell density than did S. gordonii; S. oralis did not grow reproducibly as a biofilm. Thus, only S. gordonii possessed all traits advantageous for growth as a solitary and independent resident of the tooth. Two-species biofilm experiments analyzed by laser confocal microscopy showed that neither S. oralis nor A. naeslundii grew when coaggregated pairwise with S. gordonii. However, both S. oralis and A. naeslundii showed luxuriant, interdigitated growth when paired together in coaggregated microcolonies. Thus, the S. oralis-A. naeslundii pair formed a mutualistic relationship, potentially contact dependent, that allows each to grow where neither could survive alone. S. gordonii, in contrast, neither was hindered by nor benefited from the presence of either of the other strains. The formation of mutually beneficial interactions within the developing biofilm may be essential for certain initial colonizers to be retained during early plaque development, whereas other initial colonizers may be unaffected by neighboring cells on the substratum.
Figures
FIG. 1
Flowcells and inocula used in the matrix of conditions established to investigate the effect of substratum conditioning on bacterial attachment. Two flowcells (a saliva-conditioned flowcell and a PBS-coated flowcell) were used for each strain, and the cells of each strain were treated as shown and injected into the indicated tracks.
FIG. 2
Area coverage (filled bars) and average cell cluster area (open bars) for initial adherent cell clusters of A. naeslundii (A), S. gordonii (B), and S. oralis (C). Error bars show standard deviations based on three samples (the three random fields of view). Two-letter abbreviations are as described in Materials and Methods and as shown in Fig 1. The vertical scale units are the same for both percent area coverage (filled bars) and average cell cluster area (in square micrometers) (open bars).
FIG. 3
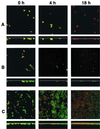
Time course (left to right) of biofilm development in saliva-conditioned glass flowcells and assessment of cell vitality using Live/Dead stain. Red cells have impaired membrane activity, whereas green cells have fully functional membranes. (A) A. naeslundii T14V. Biofilm fails to grow, and the cells lose vitality (change from green to red). (B) S. oralis 34. Biofilm fails to grow, but cells retain vitality. (C) S. gordonii DL1. Biofilm grows and an increase in the proportion of red cells is seen at 4 h and at 18 h. One representative maximum-projection image from the set of three randomly selected x-y stacks (square panels) and rotation of the maximum projection to display the x-z perspective (lower panels) are shown. Dimensions of the regions displayed are 100 μm by 100 μm (x-y perspectives; upper panels) and 100 by 30 μm (x-z perspectives; lower panels). The substratum position in the x-z perspective is indicated by the thin white line.
FIG. 4
Time course of biofilm development in coculture of S. gordonii DL1 and A. naeslundii T14V. (A) S. gordonii monoculture control (constitutive GFP expression). (B) A. naeslundii monoculture control (secondary immunofluorescence). (C) Coculture biofilm at 0 h. Inoculation was with S. gordonii (constitutive GFP expression) followed by A. naeslundii (secondary immunofluorescence, red). A. naeslundii cells are frequently located in direct proximity to S. gordonii cells. (D) Coculture biofilm after 4 h of saliva flow. Growth of S. gordonii is apparent, but no clear change in A. naeslundii biomass is discernible. (E) Coculture biofilm after 18 h of saliva flow. S. gordonii biofilm is present, whereas A. naeslundii failed to grow. Yellow regions result from superimposition of red and green during the projection process. In all six subpanels of panels A and B and in the left-hand subpanels of panels C, D, and E, one representative maximum-projection image from the set of three randomly selected x-y stacks (square panels) and rotation of the maximum projection to display the x-z perspective (rectangular panels) are shown. Dimensions of the regions displayed are 250 by 250 μm (x-y perspectives; square panels) and 250 by 73 μm (x-z perspectives; rectangular panels) in panels A and B. The image pairs presented in panels C through E are 250 by 250 μm (x-y perspective; left panel) and 83 by 83 μm (x-y perspectives; right panel); the right panel is a 3× zoom of the center portion of the left panel. For the x-z perspectives, the dimensions are 250 by 73 μm (left panel) and 83 by 24 μm (right panel); i.e., the right panel is a 3× zoom of the left panel.
FIG. 5
Time course of biofilm development in coculture of S. gordonii DL1 and S. oralis 34. (A) S. gordonii monoculture control (constitutive GFP expression). (B) S. oralis monoculture control (primary immunofluorescence, red). (C) Coculture biofilm at 0 h. Inoculation was with S. gordonii (constitutive GFP expression) followed by S. oralis (primary immunofluorescence). S. oralis cells are frequently located in direct proximity to S. gordonii cells. (D) Coculture biofilm after 4 h of saliva flow. Growth of S. gordonii is apparent, but no clear change in S. oralis biomass is discernible. (E) Coculture biofilm after 18 h of saliva flow. S. gordonii biofilm is present, whereas S. oralis failed to grow. In all six subpanels of panels A and B and in the left-hand subpanels of panels C, D, and E, one representative maximum-projection image from the set of three randomly selected x-y stacks (square panels) and rotation of the maximum projection to display the x-z perspective (rectangular panels) are shown. Dimensions of the regions displayed are as in Fig. 4.
FIG. 6
Time course of biofilm development in coculture of A. naeslundii T14V and S. oralis 34. (A) A. naeslundii monoculture control (Syto 59 staining). (B) S. oralis monoculture control (Syto 59 staining). (C) Coculture biofilm at 0 h. Inoculation was with A. naeslundii (secondary immunofluorescence, green) followed by S. oralis (primary immunofluorescence, red). S. oralis cells are frequently located in direct proximity to A. naeslundii cells. (D) Coculture biofilm after 4 h of saliva flow. Growth of both strains is apparent, especially in mixed-species colonies. Note increased interdigitation of the two cell types within the colonies. (E) Coculture biofilm after 18 h of saliva flow. Marked growth of both strains has occurred. Mixed-species colonies dominate the biomass. In all six subpanels of panels A and B and in the left-hand subpanels of panels C, D, and E, one representative maximum projection image from the set of three randomly selected x-y stacks (square panels) and rotation of the maximum projection to display x-z perspective (rectangular panels) are shown. Dimensions of the regions displayed are as in Fig. 4, except for the right x-z perspective in panel E, which is 83 by 48 μm.
Similar articles
- Fusobacterium nucleatum ATCC 10953 requires Actinomyces naeslundii ATCC 43146 for growth on saliva in a three-species community that includes Streptococcus oralis 34.
Periasamy S, Chalmers NI, Du-Thumm L, Kolenbrander PE. Periasamy S, et al. Appl Environ Microbiol. 2009 May;75(10):3250-7. doi: 10.1128/AEM.02901-08. Epub 2009 Mar 13. Appl Environ Microbiol. 2009. PMID: 19286780 Free PMC article. - Mutualistic biofilm communities develop with Porphyromonas gingivalis and initial, early, and late colonizers of enamel.
Periasamy S, Kolenbrander PE. Periasamy S, et al. J Bacteriol. 2009 Nov;191(22):6804-11. doi: 10.1128/JB.01006-09. Epub 2009 Sep 11. J Bacteriol. 2009. PMID: 19749049 Free PMC article. - Autoinducer-2 influences interactions amongst pioneer colonizing streptococci in oral biofilms.
Cuadra-Saenz G, Rao DL, Underwood AJ, Belapure SA, Campagna SR, Sun Z, Tammariello S, Rickard AH. Cuadra-Saenz G, et al. Microbiology (Reading). 2012 Jul;158(Pt 7):1783-1795. doi: 10.1099/mic.0.057182-0. Epub 2012 Apr 5. Microbiology (Reading). 2012. PMID: 22493304 Free PMC article. - Multispecies communities: interspecies interactions influence growth on saliva as sole nutritional source.
Kolenbrander PE. Kolenbrander PE. Int J Oral Sci. 2011 Apr;3(2):49-54. doi: 10.4248/IJOS11025. Int J Oral Sci. 2011. PMID: 21485308 Free PMC article. Review. - In vitro models that support adhesion specificity in biofilms of oral bacteria.
Ellen RP, Lépine G, Nghiem PM. Ellen RP, et al. Adv Dent Res. 1997 Apr;11(1):33-42. doi: 10.1177/08959374970110011401. Adv Dent Res. 1997. PMID: 9524440 Review.
Cited by
- Role of Streptococcus gordonii amylase-binding protein A in adhesion to hydroxyapatite, starch metabolism, and biofilm formation.
Rogers JD, Palmer RJ Jr, Kolenbrander PE, Scannapieco FA. Rogers JD, et al. Infect Immun. 2001 Nov;69(11):7046-56. doi: 10.1128/IAI.69.11.7046-7056.2001. Infect Immun. 2001. PMID: 11598080 Free PMC article. - Composition and development of oral bacterial communities.
Palmer RJ Jr. Palmer RJ Jr. Periodontol 2000. 2014 Feb;64(1):20-39. doi: 10.1111/j.1600-0757.2012.00453.x. Periodontol 2000. 2014. PMID: 24320954 Free PMC article. Review. - The evolution of ecological facilitation within mixed-species biofilms in the mouse gastrointestinal tract.
Lin XB, Wang T, Stothard P, Corander J, Wang J, Baines JF, Knowles SCL, Baltrūnaitė L, Tasseva G, Schmaltz R, Tollenaar S, Cody LA, Grenier T, Wu W, Ramer-Tait AE, Walter J. Lin XB, et al. ISME J. 2018 Nov;12(11):2770-2784. doi: 10.1038/s41396-018-0211-0. Epub 2018 Jul 16. ISME J. 2018. PMID: 30013162 Free PMC article. - Mucin glycans drive oral microbial community composition and function.
Wu CM, Wheeler KM, Cárcamo-Oyarce G, Aoki K, McShane A, Datta SS, Mark Welch JL, Tiemeyer M, Griffen AL, Ribbeck K. Wu CM, et al. NPJ Biofilms Microbiomes. 2023 Mar 23;9(1):11. doi: 10.1038/s41522-023-00378-4. NPJ Biofilms Microbiomes. 2023. PMID: 36959210 Free PMC article. - Candida Interactions with the Oral Bacterial Microbiota.
Montelongo-Jauregui D, Lopez-Ribot JL. Montelongo-Jauregui D, et al. J Fungi (Basel). 2018 Nov 3;4(4):122. doi: 10.3390/jof4040122. J Fungi (Basel). 2018. PMID: 30400279 Free PMC article. Review.
References
- Bassler B L. How bacteria talk to each other: regulation of gene expression by quorum sensing. Curr Opin Microbiol. 1999;2:582–587. - PubMed
- Bos R, van der Mei H C, Busscher H J. Co-adhesion of oral microbial pairs under flow in the presence of saliva and lactose. J Dent Res. 1996;75:809–815. - PubMed
- Byers H L, Tarelli E, Homer K A, Hambley H, Beighton D. Growth of viridans streptococci on human serum alpha1-acid glycoprotein. J Dent Res. 1999;78:1370–1380. - PubMed
MeSH terms
LinkOut - more resources
Full Text Sources


