Back-propagating action potentials mediate calcium signalling in dendrites of bitufted interneurons in layer 2/3 of rat somatosensory cortex - PubMed (original) (raw)
Back-propagating action potentials mediate calcium signalling in dendrites of bitufted interneurons in layer 2/3 of rat somatosensory cortex
K M Kaiser et al. J Physiol. 2001.
Abstract
1. Bitufted interneurons in layer 2/3 of the rat (P14) somatosensory cortex have elongated apical and basal dendritic arbors that can span the entire depth of the cortex. Simultaneous dendritic and somatic whole-cell voltage recordings combined with Ca2+ fluorescence measurements were made to quantify voltage and Ca2+ signalling in dendritic arbors of bitufted neurons. 2. Action potentials (APs) initiated close to the soma by brief current injection back-propagated into the apical and basal dendritic arbors and evoked a transient increase in volume-averaged dendritic Ca2+ concentration (Delta[Ca(2+)](i)) of about 140 nM peak amplitude per AP. The AP evoked Ca2+ signal decayed with a time constant of about 200 ms. 3. A relatively high endogenous Ca(2+) binding ratio of approximately 285 determines the comparatively small rise in [Ca(2+)](i) of bitufted cell dendrites evoked by a back-propagating AP. 4. The [Ca(2+)](i) transient evoked by back-propagating dendritic APs decreased with distance (< or = 50 microm) from the soma in some neurons. At distances greater than 50 microm transients did not show a spatial gradient between the proximal and distal dendritic branches. 5. During trains of APs the mean amplitude of the steady-state increase in dendritic [Ca(2+)](i) encoded the AP frequency linearly up to 40 Hz with a slope of 20 nM Hz(-1). 6. The results suggest that APs initiated in the axon of bitufted neurons back-propagate and 'copy' the pattern of the axon's electrical activity also to the dendritic arbor. The AP pattern is transduced into a transient rise of dendritic [Ca(2+)](i) which, presumably, can regulate the receptive properties of the dendritic arbor for synaptic input. 7. Bitufted interneurons in layer 2/3 of the rat (P14) somatosensory cortex have elongated apical and basal dendritic arbors that can span the entire depth of the cortex. Simultaneous dendritic and somatic whole-cell voltage recordings combined with Ca2+ fluorescence measurements were made to quantify voltage and Ca2+ signalling in dendritic arbors of bitufted neurons. 8. Action potentials (APs) initiated close to the soma by brief current injection back-propagated into the apical and basal dendritic arbors and evoked a transient increase in volume-averaged dendritic Ca2+ concentration (Delta[Ca(2+)](i)) of about 140 nM peak amplitude per AP. The AP evoked Ca2+ signal decayed with a time constant of about 200 ms. 9. A relatively high endogenous Ca2+ binding ratio of approximately 285 determines the comparatively small rise in [Ca(2+)](i) of bitufted cell dendrites evoked by a back-propagating AP. 10. The [Ca(2+)](i) transient evoked by back-propagating dendritic APs decreased with distance (< or = 50 microm) from the soma in some neurons. At distances greater than 50 microm transients did not show a spatial gradient between the proximal and distal dendritic branches. 11. During trains of APs the mean amplitude of the steady-state increase in dendritic [Ca(2+)](i) encoded the AP frequency linearly up to 40 Hz with a slope of 20 nM Hz(-1). 12. The results suggest that APs initiated in the axon of bitufted neurons back-propagate and also 'copy' the pattern of the axon's electrical activity to the dendritic arbor. The AP pattern is transduced into a transient rise of dendritic [Ca(2+)](i) which, presumably, can regulate the receptive properties of the dendritic arbor for synaptic input.
Figures
Figure 1. Correction factors for measured peak [Ca2+]i amplitudes (Methods)
Dependence of the correction factor for [Ca2+]i amplitudes on the measured peak [Ca2+]i amplitude. Correction factors were calculated for bitufted neurons according to eqn (3) using the endogenous Ca2+ binding ratio of κS = 285 and the [Ca2+]i resting level of 75 n
m
. Correction factors were plotted for different fura-2 concentrations.
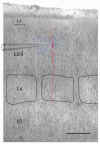
Figure 2. Location of a layer 2/3 bitufted interneuron in relation to individual cortical columns
Superposition of an IR-DIC video image of a thalamocortical brain slice with recording pipette and reconstruction of a bitufted interneuron filled with biocytin. The dendritic arbor of the interneuron is shown in red, the axonal arbor in blue. Borders of barrels in layer 4 are outlined in black. Scale bar 200 μm.
Figure 3. Dendritic and axonal arbors of a layer 2/3 bitufted interneuron
A, reconstruction of the dendritic arbor of a bitufted interneuron filled with biocytin. The dendritic arbor almost spans the width of the cortex and shows the arborization typical for bitufted cells. B, light microscopic image of the soma and initial parts of dendrites and axon of the bitufted cell shown in A. The axon originates from the soma and is indicated by white arrows. Note that some dendritic branches are spiny. Scale bar 20 μm. C, dendritic and axonal arbor of the same cell. Axon collaterals (blue) project predominantly to the supragranular layers. Some axon collaterals project in parallel with the basal dendritic branches to infragranular layers. D, characteristic firing pattern of a bitufted interneuron upon current injection. Resting membrane potential was −60 mV. Data are taken from a different neuron than that illustrated in A-C.
Figure 4. Action potentials in soma and dendrites of bitufted neurons
A, IR-DIC video image of soma and principal apical and basal dendrites and somatic and dendritic recording pipettes. The axon of this neuron originated from the soma. Scale bar 10 μm. B, simultaneous dual somatic and dendritic whole-cell voltage recording. APs evoked by current injection through either somatic (left) or dendritic (middle) recording pipette. Data are from a different neuron than shown in A. The axon originated from the soma as shown by the partial reconstruction of the interneuron (right). C, simultaneous somatic and dendritic APs. Stimulating protocols according to B. The axon of this neuron originated from an apical dendrite between the recording pipettes as shown in the partial reconstruction (right). D, relative amplitudes and delay between dendritic and somatic APs. Time delay of AP peaks is plotted as a function of distance between recording pipettes (right). Values from 25 paired recordings. The data for neurons which showed a delay between somatic and dendritic APs (○) were fitted by linear regression with a slope of 2 μs μm−1. In other experiments (•) the dendritic patch pipette was located close to the dendrite from which the axon originated. Comparison of amplitudes does not indicate a difference between somatic and dendritic APs up to 50 μm away from the soma.
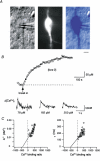
Figure 5. Endogenous Ca2+ binding ratio of dendrites of bitufted neurons
A, identification and fura-2 loading of bitufted interneurons in layer 2/3. Left, IR-DIC image of the soma and initial segments of principal apical and basal dendrites of a bitufted neuron. Note the elongated shape of the soma. The rectangle indicates a region selected on a primary basal dendrite which was used for the loading curve measurements. Middle, fluorescence image of the same neuron after complete loading with 250 μ
m
fura-2. Right, digital superposition in pseudo-colour of the IR-DIC image and fluorescence image of the same neuron. Scale bar 5 μm. B, fura-2 (250 μ
m
) loading curve of the proximal region of a primary basal dendrite. Fluorescence recordings were made from the dendritic region indicated by the rectangle in A at different times after pipette ‘break-in’. The loading curve was fitted with a single exponential (τ = 137 s). The half-loading time was about 2 min. Single APs were initiated by 8 ms step current injection via the somatic patch pipette. Traces (lower part) represent the ratiometrically calculated [Ca2+]i transients at different times during loading (• in graph). Continuous line indicates fitted exponential. The decay time constant of the Ca2+ transient was 137 ms at a fura-2 concentration of 78 μ
m
and increased to 243 ms at 250 μ
m
fura-2. Ca2+ traces are single sweeps. C, peak amplitude and decay time constant of [Ca2+]i transients of the same neuron evoked by a single AP were plotted versus the Ca2+ binding ratio calculated according to eqn (2) (Methods). Negative _X_-axis intercepts of 410 and 519 are estimates for the endogenous Ca2+ binding ratio of this neuron.
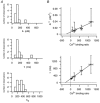
Figure 6. Amplitude and time course of dendritic [Ca2+]i transients in bitufted neurons
A, histograms for dendritic Ca2+ signalling of bitufted neurons obtained after loading single cells with fura-2. Data are from 11 recording sites of 7 different neurons. [Ca2+]i transients had a mean peak amplitude of 136 n
m
(top) and a decay time constant of 170 ms (middle). The average endogenous Ca2+ binding ratio was 285 (bottom). See also Table 2. B, dependence of dendritic [Ca2+]i amplitudes (top) and decay time constants (bottom) evoked by single APs on the Ca2+ binding ratio of bitufted neurons. Data are pooled from different neurons (n = 45) filled with different concentrations of fura-2 (○). Decay time constants from experiments with Oregon Green 488 BAPTA-5N (•, n = 4) are in line with those obtained with fura-2. The peak amplitude and decay time constant of [Ca2+]i amplitudes without exogenous buffer were 150 n
m
and 218 ms, respectively. Negative _X_-axis intercepts of the [Ca2+]i amplitudes and decay time constants give endogenous Ca2+ binding ratios of 263 and 302, respectively. See also Table 2.
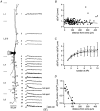
Figure 7
Dendritic [Ca2+]i transients evoked by trains of APs A, dendritic [Ca2+]i transients evoked by a train of APs for 2 s: AP frequency was 2, 8, 20 and 40 Hz. Recordings were made 10 μm from the soma after loading the neuron for 10 min with 100 μ
m
fura-2. Horizontal lines indicate the plateau value of [Ca2+]i calculated as the average value of the last second. Rise times were fitted by single exponentials and were 529 ms (2 Hz), 518 ms (8 Hz), 580 ms (20 Hz) and by double exponential for 40 Hz with time constants of 138 ms and 1891 ms. B, example of the dependence of dendritic [Ca2+]i plateau on frequency of APs (same neuron as in A). The data were fitted by a linear regression (slope: 20 n
m
Hz−1). C, histogram of linear regression slopes for all experiments. The data represent measurements from 10 dendritic regions (21 ± 13 μm from soma) of 4 different bitufted neurons. The mean increase of the [Ca2+]i plateau level was 23 ± 6 n
m
Hz−1 (n = 10).
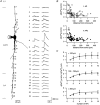
Figure 8. Spatial profile of dendritic [Ca2+]i transients evoked by a single AP and bursts of 4 APs
A, reconstruction from the fluorescence image of a bitufted neuron loaded with 100 μ
m
fura-2. Location of selected regions for Ca2+ measurements on apical and basal dendrites at different distances from the soma are indicated by rectangles and numbers. The reconstruction is a montage from several fluorescence images taken successively. The corresponding dendritic [Ca2+]i transients evoked by either a single AP or a short burst of 4 APs at 80 Hz are shown on the right for each recording site. To account for the influence of fura-2 on the [Ca2+]i transients, [Ca2+]i amplitudes are underestimated by a factor of approximately 2. Note the decrease in amplitude in one of the initial dendritic segments. B, dependence of the peak [Ca2+]i amplitude evoked by a single AP (upper) and bursts of 4 APs (lower) on distance from the soma. Results from 10 dendrites from 6 neurons were normalized for dendrites without initial decrease to the amplitude of the dendritic [Ca2+]i transient nearest to the soma. For the other dendrites amplitudes were normalized to the [Ca2+]i amplitude beyond the initial decrease. For proximal regions (≤ 50 μm) large values illustrate dendrites which show decrease of [Ca2+]i amplitude in the initial portion. C, dependence of [Ca2+]i amplitudes on the number of APs for proximal (upper), intermediate (middle) and distal dendritic regions (lower). [Ca2+]i transients were evoked by a single or a short train of APs (up to 10) at 80 Hz. The corresponding [Ca2+]i amplitudes were normalized to the [Ca2+]i amplitude evoked by a single AP. Data for proximal, intermediate and distal regions were taken on average 38 ± 69 μm (n = 69 regions, 12 neurons), 148 ± 30 μm (n = 20 regions, 4 neurons) and 250 ± 42 μm (n = 11 regions, 2 neurons) distal from the soma, respectively.
Figure 9
Dendritic [Ca2+]i hot spots and dependence of dendritic [Ca2+]i signals on active back-propagation A, reconstruction from the fluorescence image of a bitufted neuron. Fura-2 concentration in the recording pipette was 500 μ
m
. Location of selected regions for Ca2+ measurements on apical and basal dendrites at different distances from the soma are indicated by rectangles and numbers. The reconstruction is a montage from several fluorescence images taken successively. The corresponding dendritic [Ca2+]i transients evoked by a short burst of 4 APs at 80 Hz are shown on the right for each recording site. To account for the influence of fura-2 on the [Ca2+]i transients, [Ca2+]i amplitudes are underestimated by a factor of approximately 4. B, dependence of the peak [Ca2+]i amplitude on distance from the soma: Results from 11 neurons were normalized to the amplitude of the dendritic [Ca2+]i transient closest to the soma. In each neuron, [Ca2+]i transients were evoked by short bursts of 4 APs at 80 Hz. Data are approximated by linear regression (r = -0.14). C, dependence of [Ca2+]i amplitudes on the number of APs. [Ca2+]i transients were evoked by a single or short train of APs (up to 10) at 80 Hz. The corresponding [Ca2+]i amplitudes were normalized to the [Ca2+]i amplitude evoked by a single AP. A plateau value for the [Ca2+]i amplitude, which was 2.9-fold that of a single AP, was reached with 6 APs. Continuous line shows an exponential fit, dashed lines show the corresponding fits for experiments with 4 APs at 50 and 90 Hz (raw data not shown). Data were taken from 10 dendritic regions out of 5 neurons. Regions were located on average 15 ± 10 μm from the soma. D, effect of TTX on dendritic Ca2+ transients. Neurons (n = 3) were voltage clamped at the soma and the AP waveform was used as a voltage-clamp command. The [Ca2+]i transient measured at the soma before TTX application served as a control. In the presence of TTX the AP waveform voltage clamp command was increased until a similar somatic [Ca2+]i transient was obtained as in control. The line represents a linear regression (r = -0.93).
Similar articles
- Postsynaptic calcium influx at single synaptic contacts between pyramidal neurons and bitufted interneurons in layer 2/3 of rat neocortex is enhanced by backpropagating action potentials.
Kaiser KM, Lübke J, Zilberter Y, Sakmann B. Kaiser KM, et al. J Neurosci. 2004 Feb 11;24(6):1319-29. doi: 10.1523/JNEUROSCI.2852-03.2004. J Neurosci. 2004. PMID: 14960603 Free PMC article. - Dendritic mechanisms underlying the coupling of the dendritic with the axonal action potential initiation zone of adult rat layer 5 pyramidal neurons.
Larkum ME, Zhu JJ, Sakmann B. Larkum ME, et al. J Physiol. 2001 Jun 1;533(Pt 2):447-66. doi: 10.1111/j.1469-7793.2001.0447a.x. J Physiol. 2001. PMID: 11389204 Free PMC article. - Dendritic calcium transients evoked by single back-propagating action potentials in rat neocortical pyramidal neurons.
Markram H, Helm PJ, Sakmann B. Markram H, et al. J Physiol. 1995 May 15;485 ( Pt 1)(Pt 1):1-20. doi: 10.1113/jphysiol.1995.sp020708. J Physiol. 1995. PMID: 7658365 Free PMC article. - From single cells and single columns to cortical networks: dendritic excitability, coincidence detection and synaptic transmission in brain slices and brains.
Sakmann B. Sakmann B. Exp Physiol. 2017 May 1;102(5):489-521. doi: 10.1113/EP085776. Epub 2017 Apr 21. Exp Physiol. 2017. PMID: 28139019 Free PMC article. Review. - Dendritic potassium channels in hippocampal pyramidal neurons.
Johnston D, Hoffman DA, Magee JC, Poolos NP, Watanabe S, Colbert CM, Migliore M. Johnston D, et al. J Physiol. 2000 May 15;525 Pt 1(Pt 1):75-81. doi: 10.1111/j.1469-7793.2000.00075.x. J Physiol. 2000. PMID: 10811726 Free PMC article. Review.
Cited by
- Mutational analysis of dendritic Ca2+ kinetics in rodent Purkinje cells: role of parvalbumin and calbindin D28k.
Schmidt H, Stiefel KM, Racay P, Schwaller B, Eilers J. Schmidt H, et al. J Physiol. 2003 Aug 15;551(Pt 1):13-32. doi: 10.1113/jphysiol.2002.035824. Epub 2003 Jun 17. J Physiol. 2003. PMID: 12813159 Free PMC article. - Transient compartmentalization of interneuron dendrites.
McBain CJ. McBain CJ. J Physiol. 2003 Aug 15;551(Pt 1):1. doi: 10.1113/jphysiol.2003.047589. Epub 2003 Jun 17. J Physiol. 2003. PMID: 12813141 Free PMC article. No abstract available. - Somatic spikes regulate dendritic signaling in small neurons in the absence of backpropagating action potentials.
Myoga MH, Beierlein M, Regehr WG. Myoga MH, et al. J Neurosci. 2009 Jun 17;29(24):7803-14. doi: 10.1523/JNEUROSCI.0030-09.2009. J Neurosci. 2009. PMID: 19535592 Free PMC article. - Chandelier cells control excessive cortical excitation: characteristics of whisker-evoked synaptic responses of layer 2/3 nonpyramidal and pyramidal neurons.
Zhu Y, Stornetta RL, Zhu JJ. Zhu Y, et al. J Neurosci. 2004 Jun 2;24(22):5101-8. doi: 10.1523/JNEUROSCI.0544-04.2004. J Neurosci. 2004. PMID: 15175379 Free PMC article. - Putting a finishing touch on GECIs.
Rose T, Goltstein PM, Portugues R, Griesbeck O. Rose T, et al. Front Mol Neurosci. 2014 Nov 18;7:88. doi: 10.3389/fnmol.2014.00088. eCollection 2014. Front Mol Neurosci. 2014. PMID: 25477779 Free PMC article. Review.
References
- Agmon A, Connors B W. Thalamocortical responses of mouse somatosensory (barrel) cortex in vitro. Neuroscience. 1991;41:365–379. - PubMed
- Alger B E, Pitler T A. Retrograde signaling at GABAA-receptor synapses in the mammalian CNS. Trends in Neurosciences. 1995;18:333–340. - PubMed
- Grynkiewicz G, Poenie M, Tsien R Y. A new generation of Ca2+ indicators with greatly improved fluorescence properties. Journal of Biological Chemistry. 1985;260:3440–3450. - PubMed
- Häusser M, Stuart G, Racca C, Sakmann B. Axonal initiation and active dendritic propagation of action potentials in substantia nigra neurons. Neuron. 1995;15:637–647. - PubMed
MeSH terms
Substances
LinkOut - more resources
Full Text Sources
Research Materials
Miscellaneous

