Global differential gene expression in response to growth temperature alteration in group A Streptococcus - PubMed (original) (raw)
Global differential gene expression in response to growth temperature alteration in group A Streptococcus
L M Smoot et al. Proc Natl Acad Sci U S A. 2001.
Abstract
Pathogens are exposed to different temperatures during an infection cycle and must regulate gene expression accordingly. However, the extent to which virulent bacteria alter gene expression in response to temperatures encountered in the host is unknown. Group A Streptococcus (GAS) is a human-specific pathogen that is responsible for illnesses ranging from superficial skin infections and pharyngitis to severe invasive infections such as necrotizing fasciitis and streptococcal toxic shock syndrome. GAS survives and multiplies at different temperatures during human infection. DNA microarray analysis was used to investigate the influence of temperature on global gene expression in a serotype M1 strain grown to exponential phase at 29 degrees C and 37 degrees C. Approximately 9% of genes were differentially expressed by at least 1.5-fold at 29 degrees C relative to 37 degrees C, including genes encoding transporter proteins, proteins involved in iron homeostasis, transcriptional regulators, phage-associated proteins, and proteins with no known homologue. Relatively few known virulence genes were differentially expressed at this threshold. However, transcription of 28 genes encoding proteins with predicted secretion signal sequences was altered, indicating that growth temperature substantially influences the extracellular proteome. TaqMan real-time reverse transcription-PCR assays confirmed the microarray data. We also discovered that transcription of genes encoding hemolysins, and proteins with inferred roles in iron regulation, transport, and homeostasis, was influenced by growth at 40 degrees C. Thus, GAS profoundly alters gene expression in response to temperature. The data delineate the spectrum of temperature-regulated gene expression in an important human pathogen and provide many unforeseen lines of pathogenesis investigation.
Figures
Figure 1
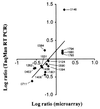
Correlation of microarray and TaqMan assays. The fold difference in the number of cDNA molecules present at 29°C relative to 37°C for 15 genes influenced by temperature was log-transformed, and values were plotted. Points on the graph represent genes that were analyzed by both methods.
Figure 2
Differentially expressed GAS genes at 29°C relative to 37°C. The number of up-regulated (filled bars) and down-regulated (stippled bars) genes in each functional group is shown.
Figure 3
Differential utilization of glucose and concomitant lactate accumulation in GAS grown at 29°C and 37°C. The concentration of glucose (closed symbols) and lactate (open symbols) present in culture supernatants of GAS grown at 29°C (triangles) and 37°C (circles) was measured.
Figure 4
RT-PCR analysis of a polycistronic mRNA encoding a putative iron transporter. RNA from GAS grown at 29°C was reverse-transcribed into cDNA, and PCR was done with ORF-specific primers. The templates for PCR were SF370 genomic DNA (lanes 3, 5, 7, and 9), cDNA (lanes 4, 6, 8, and 10), and RNA (lane 2). Primers for PCR were 0383–5′ and 0383–3′ (lanes 2–4); 0383–5′ and 0384–3′ (lanes 5 and 6); 0383–5′ and 0385–3′ (lanes 7 and 8); and 0383–5′ and 0386–3′ (lanes 9 and 10). The schematic shows the arrangement of the genes in the chromosome, including intergenic spaces, and the black box represents the putative promoter. The average fold difference in transcription of each ORF at 29°C relative to 37°C was determined with TaqMan assays. The SEM is shown in parentheses. Dashes denote DNA sizes in the 100-bp (lane 1) and 1-kb (lane 11) ladders.
Figure 5
TaqMan analysis of GAS genes influenced by growth at 40°C. TaqMan assays were done with RNA isolated from independent cultures of GAS grown at 40°C and 37°C. The average fold difference in transcription at 40°C relative to 37°C is shown.
Figure 6
Schematic of putative promoters of temperature-regulated iron metabolism-related genes. Potential promoters (yellow boxes noting −10 and −35 regions) and ribosomal binding sites (RBS) are shown. The nucleotide sequences with similarity to the B. subtilis dhb Fur box (red line) and B. subtilis fhuD Fur box 2 (blue line) consensus sequences are shown. The Fur box consensus sequences are shown in green. Dyad repeats are denoted below the line with red, black, green, and blue arrows. An indirect repeat is denoted below the line by black arrows lacking a closed arrowhead.
Figure 7
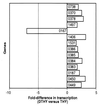
Iron-limiting growth conditions influence GAS gene expression. TaqMan assays were done with RNA isolated from independent cultures of GAS grown at 40°C in DTHY and THY. The average fold difference in transcription in DTHY relative to THY is shown. Spy numbers of the relevant genes are shown.
Similar articles
- Expression microarray and mouse virulence analysis of four conserved two-component gene regulatory systems in group a streptococcus.
Sitkiewicz I, Musser JM. Sitkiewicz I, et al. Infect Immun. 2006 Feb;74(2):1339-51. doi: 10.1128/IAI.74.2.1339-1351.2006. Infect Immun. 2006. PMID: 16428783 Free PMC article. - Global profiling of Streptococcus pneumoniae gene expression at different growth temperatures.
Pandya U, Allen CA, Watson DA, Niesel DW. Pandya U, et al. Gene. 2005 Oct 24;360(1):45-54. doi: 10.1016/j.gene.2005.06.023. Epub 2005 Sep 8. Gene. 2005. PMID: 16154298 - Growth phase-associated changes in the transcriptome and proteome of Streptococcus pyogenes.
Chaussee MA, Dmitriev AV, Callegari EA, Chaussee MS. Chaussee MA, et al. Arch Microbiol. 2008 Jan;189(1):27-41. doi: 10.1007/s00203-007-0290-1. Epub 2007 Jul 31. Arch Microbiol. 2008. PMID: 17665172 - Molecular pathogenesis of necrotizing fasciitis.
Olsen RJ, Musser JM. Olsen RJ, et al. Annu Rev Pathol. 2010;5:1-31. doi: 10.1146/annurev-pathol-121808-102135. Annu Rev Pathol. 2010. PMID: 19737105 Review. - How group A Streptococcus circumvents host phagocyte defenses.
Kwinn LA, Nizet V. Kwinn LA, et al. Future Microbiol. 2007 Feb;2(1):75-84. doi: 10.2217/17460913.2.1.75. Future Microbiol. 2007. PMID: 17661677 Review.
Cited by
- Alternatives to animal models to study bacterial infections.
Hu C, Yang W. Hu C, et al. Folia Microbiol (Praha). 2023 Oct;68(5):703-739. doi: 10.1007/s12223-023-01084-6. Epub 2023 Aug 26. Folia Microbiol (Praha). 2023. PMID: 37632640 Review. - Studies of Streptococcus anginosus Virulence in Dictyostelium discoideum and Galleria mellonella Models.
Budziaszek J, Pilarczyk-Zurek M, Dobosz E, Kozinska A, Nowicki D, Obszanska K, Szalewska-Pałasz A, Kern-Zdanowicz I, Sitkiewicz I, Koziel J. Budziaszek J, et al. Infect Immun. 2023 May 16;91(5):e0001623. doi: 10.1128/iai.00016-23. Epub 2023 Apr 25. Infect Immun. 2023. PMID: 37097148 Free PMC article. - A Shift to Human Body Temperature (37°C) Rapidly Reprograms Multiple Adaptive Responses in Escherichia coli That Would Facilitate Niche Survival and Colonization.
Gant Kanegusuku A, Stankovic IN, Cote-Hammarlof PA, Yong PH, White-Ziegler CA. Gant Kanegusuku A, et al. J Bacteriol. 2021 Oct 25;203(22):e0036321. doi: 10.1128/JB.00363-21. Epub 2021 Sep 13. J Bacteriol. 2021. PMID: 34516284 Free PMC article. - Colonization of the Murine Oropharynx by Streptococcus pyogenes Is Governed by the Rgg2/3 Quorum Sensing System.
Gogos A, Federle MJ. Gogos A, et al. Infect Immun. 2020 Sep 18;88(10):e00464-20. doi: 10.1128/IAI.00464-20. Print 2020 Sep 18. Infect Immun. 2020. PMID: 32747598 Free PMC article. - Biochemical characterization of bacterial FeoBs: A perspective on nucleotide specificity.
Shin M, Park J, Jin Y, Kim IJ, Payne SM, Kim KH. Shin M, et al. Arch Biochem Biophys. 2020 May 30;685:108350. doi: 10.1016/j.abb.2020.108350. Epub 2020 Mar 24. Arch Biochem Biophys. 2020. PMID: 32220566 Free PMC article.
References
- VanHeyningen T, Fogg G, Yates D, Hanski E, Caparon M. Mol Microbiol. 1993;9:1213–1222. - PubMed
MeSH terms
Substances
LinkOut - more resources
Full Text Sources
Other Literature Sources


