Silencing of Wnt signaling and activation of multiple metabolic pathways in response to thyroid hormone-stimulated cell proliferation - PubMed (original) (raw)
Silencing of Wnt signaling and activation of multiple metabolic pathways in response to thyroid hormone-stimulated cell proliferation
L D Miller et al. Mol Cell Biol. 2001 Oct.
Abstract
To investigate the transcriptional program underlying thyroid hormone (T3)-induced cell proliferation, cDNA microarrays were used to survey the temporal expression profiles of 4,400 genes. Of 358 responsive genes identified, 88% had not previously been reported to be transcriptionally or functionally modulated by T3. Partitioning the genes into functional classes revealed the activation of multiple pathways, including glucose metabolism, biosynthesis, transcriptional regulation, protein degradation, and detoxification in T3-induced cell proliferation. Clustering the genes by temporal expression patterns provided further insight into the dynamics of T3 response pathways. Of particular significance was the finding that T3 rapidly repressed the expression of key regulators of the Wnt signaling pathway and suppressed the transcriptional downstream elements of the beta-catenin-T-cell factor complex. This was confirmed biochemically, as beta-catenin protein levels also decreased, leading to a decrease in the transcriptional activity of a beta-catenin-responsive promoter. These results indicate that T3-induced cell proliferation is accompanied by a complex coordinated transcriptional reprogramming of many genes in different pathways and that early silencing of the Wnt pathway may be critical to this event.
Figures
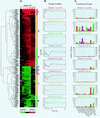
FIG. 1
(A) Expression dynamics of T3-responsive genes. Temporal expression profiles of 387 arrayed features exhibiting change over time in response to T3 were hierarchically clustered by Euclidean distance measurement and visualized in a clustergram using Treeview software (see Materials and Methods). Microarray experiments for each time point are in columns; individual genes are in rows. Red indicates increasing mRNA levels and green denotes decreasing mRNA levels. The degree of color saturation reflects the magnitude of the ratio (see color key at the bottom). (B) Cluster profiles. Gene expression profiles were algorithmically subdivided into eight clusters (shown to the right of the clustergram by colored bars). The average expression profile of each gene cluster is shown in a line graph and is colored according to the matching bars. n, number of array features within each cluster. Error bars show standard deviations. (C) Distribution of functional groups across clusters. The number of individual genes comprising each functional group is indicated for each cluster profile. The cluster sizes differ from those in panel B because single genes having multiple expression profiles owing to redundant spotting on the microarrays were counted only once per functional group to prevent overrepresentation bias. For 5 of 19 redundant genes, two or more expression profiles fell into more than one cluster. In three cases, the gene was counted in the cluster that contained two of the three same-gene profiles, and in two cases where two profiles fell into two clusters, the gene was placed in the cluster whose mean had the smallest Euclidean distance from the two profiles.
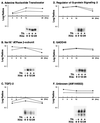
FIG. 2
Concordance of gene expression patterns determined by microarray and Northern blotting. Expression ratios of six genes identified as outliers by microarray were determined by Northern blot analysis at three time points following T3 exposure. Intensities of the Northern bands were quantified (as described in Materials and Methods) and used to calculate expression ratios, with the Td reference intensity in the denominator. Ratios derived from Northern blots (○) are compared to the microarray results (●). Representative mRNA bands are shown.
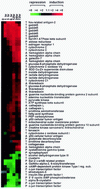
FIG. 3
Clustergram of genes previously implicated in T3 action. Each of the named outlier genes identified in our screen was searched via PubMed for a reported association with T3. A clustergram of the T3-associated genes is shown. T, gene shown to be regulated transcriptionally by T3; P, gene whose product is reportedly modulated by T3 (e.g., protein levels, activity, specific activity, and posttranslational modifications); A, gene whose product is known to be associated with T3 processing or signaling.
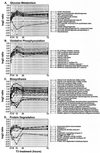
FIG. 4
Temporal profiles of genes involved in glucose metabolism, oxidative phosphorylation, biosynthesis, and protein degradation. Shown are the expression trajectories of genes comprising the functional subgroups glucose metabolism (A), oxidative phosphorylation (B), and protein degradation (D) and the functional group biosynthesis (C). Each gene expression profile is the log-transformed expression ratio (y axis) plotted against hours post-T3 treatment (x axis).
FIG. 5
(A) Trend lines for early (E), intermediate (I), and late (L) T3 response genes. Outlier genes were segregated into temporal expression groups based on the timing (in parentheses) of their peak ratios. The median expression ratio at each time point in each group is plotted. n, number of genes in each expression group. (B) Kinetics of T3 response pathways. Annotated genes were grouped according to cellular function (Table 1) and partitioned into temporal expression groups to visualize the T3-induced activation of cellular pathways as a function of time. The pathways are in columns, and the temporal expression groups are in rows. Each arrow represents a single gene, and its direction reflects up- or down-regulation. (C) Early repression of T3-responsive genes of the Wnt pathway. The kinetics of Wnt pathway-associated genes (encoding β-catenin, TCF4, Dishevelled-1, Frizzled, axin, and APC) are shown.
FIG. 6
(A) Response of Wnt signaling genes to T3. Temporal expression profiles of the six canonical Wnt signaling components present on the microarray, a putative regulator of the pathway (IGF-1), and one transcriptional target (c-jun) are shown. β-Catenin, TCF4, Dishevelled-1, IGF-1 and c-jun were selected in the initial high-stringency screening procedure for T3-responsive genes. Axin, APC, and Frizzled were not uncovered by the initial screen. Axin and APC did not demonstrate expression ratios of twofold or higher at at least two time points, and the Frizzled array feature failed to achieve a signal-to-background ratio of ≥2.0 at more than one time point. Despite these selection criterion discrepancies, both axin and Frizzled displayed expression trajectories consistent with time-dependent differential expression and further support the repression hypothesis. APC showed a small increase but did not demonstrate a profile consistent with sustained differential expression. c-jun, though not a specific component of Wnt signaling, is a transcriptional target of β-catenin–TCF and is down-regulated in a fashion consistent with repression of this pathway. The 12-h expression ratio for Dishevelled-1 was filter excluded in the initial screen due to a low signal-to-background ratio and was therefore omitted from the line graph. (B and C) Western blot analysis of β-catenin and axin. After cells were treated with T3 for the time indicated, 50 μg of cell lysates were analyzed by sodium dodecyl sulfate–10% polyacrylamide gel electrophoresis. Western blot analysis was carried out using anti-β-catenin or antiaxin antibodies as described in Materials and Methods.
FIG. 7
Repression of β-catenin–TCF transactivation activity by T3. GC cells transfected with TCF reporter plasmid (pGL3-OT; 1 μg) and β-galactosidase expression plasmid (pCH110; 0.5 μg) were treated with or without T3 (100 nM) as described in Materials and Methods. Cell lysates were prepared, and the luciferase activities were determined at the times indicated. The luciferase activities were normalized against the β-galactosidase activities. Control, Td activity. Error bars reflect the standard deviations in triplicate experiments.
Similar articles
- Novel candidate targets of beta-catenin/T-cell factor signaling identified by gene expression profiling of ovarian endometrioid adenocarcinomas.
Schwartz DR, Wu R, Kardia SL, Levin AM, Huang CC, Shedden KA, Kuick R, Misek DE, Hanash SM, Taylor JM, Reed H, Hendrix N, Zhai Y, Fearon ER, Cho KR. Schwartz DR, et al. Cancer Res. 2003 Jun 1;63(11):2913-22. Cancer Res. 2003. PMID: 12782598 - Identification of a mouse homolog of the human BTEB2 transcription factor as a beta-catenin-independent Wnt-1-responsive gene.
Ziemer LT, Pennica D, Levine AJ. Ziemer LT, et al. Mol Cell Biol. 2001 Jan;21(2):562-74. doi: 10.1128/MCB.21.2.562-574.2001. Mol Cell Biol. 2001. PMID: 11134343 Free PMC article. - Thyroid hormone interacts with the Wnt/beta-catenin signaling pathway in the terminal differentiation of growth plate chondrocytes.
Wang L, Shao YY, Ballock RT. Wang L, et al. J Bone Miner Res. 2007 Dec;22(12):1988-95. doi: 10.1359/jbmr.070806. J Bone Miner Res. 2007. PMID: 17708712 - The Yin-Yang of TCF/beta-catenin signaling.
Barker N, Morin PJ, Clevers H. Barker N, et al. Adv Cancer Res. 2000;77:1-24. doi: 10.1016/s0065-230x(08)60783-6. Adv Cancer Res. 2000. PMID: 10549354 Review. - New steps in the Wnt/beta-catenin signal transduction pathway.
Sakanaka C, Sun TQ, Williams LT. Sakanaka C, et al. Recent Prog Horm Res. 2000;55:225-36. Recent Prog Horm Res. 2000. PMID: 11036939 Review.
Cited by
- Cross-regulation of signaling pathways: an example of nuclear hormone receptors and the canonical Wnt pathway.
Beildeck ME, Gelmann EP, Byers SW. Beildeck ME, et al. Exp Cell Res. 2010 Jul 1;316(11):1763-72. doi: 10.1016/j.yexcr.2010.02.001. Epub 2010 Feb 6. Exp Cell Res. 2010. PMID: 20138864 Free PMC article. Review. - Hypothyroidism and Cognitive Disorders during Development and Adulthood: Implications in the Central Nervous System.
Salazar P, Cisternas P, Martinez M, Inestrosa NC. Salazar P, et al. Mol Neurobiol. 2019 Apr;56(4):2952-2963. doi: 10.1007/s12035-018-1270-y. Epub 2018 Aug 2. Mol Neurobiol. 2019. PMID: 30073507 Review. - Molecular characterization of thyroid toxicity: anchoring gene expression profiles to biochemical and pathologic end points.
Glatt CM, Ouyang M, Welsh W, Green JW, Connor JO, Frame SR, Everds NE, Poindexter G, Snajdr S, Delker DA. Glatt CM, et al. Environ Health Perspect. 2005 Oct;113(10):1354-61. doi: 10.1289/ehp.7690. Environ Health Perspect. 2005. PMID: 16203246 Free PMC article. - Metamorphic gene regulation programs in Xenopus tropicalis tadpole brain.
Raj S, Sifuentes CJ, Kyono Y, Denver RJ. Raj S, et al. PLoS One. 2023 Jun 29;18(6):e0287858. doi: 10.1371/journal.pone.0287858. eCollection 2023. PLoS One. 2023. PMID: 37384728 Free PMC article. - Restoration of type 1 iodothyronine deiodinase expression in renal cancer cells downregulates oncoproteins and affects key metabolic pathways as well as anti-oxidative system.
Popławski P, Wiśniewski JR, Rijntjes E, Richards K, Rybicka B, Köhrle J, Piekiełko-Witkowska A. Popławski P, et al. PLoS One. 2017 Dec 22;12(12):e0190179. doi: 10.1371/journal.pone.0190179. eCollection 2017. PLoS One. 2017. PMID: 29272308 Free PMC article.
References
- Angeras U, Hasselgren P O. Protein turnover in different types of skeletal muscle during experimental hyperthyroidism in rats. Acta Endocrinol (Copenhagen) 1985;109:90–95. - PubMed
- Barrera-Hernandez G, Park K S, Dace A, Zhan A, Cheng S-Y. Thyroid hormone-induced cell proliferation in GC cells is mediated by changes in G1 cyclin/cyclin-dependent kinase levels and activity. Endocrinology. 1999;140:5267–5274. - PubMed
- Barrera-Hernandez G, Zhan Q, Wong R, Cheng S-Y. Thyroid hormone receptor is a negative regulator in p53-mediated signaling pathways. DNA Cell Biol. 1998;17:743–750. - PubMed
- Bernal J, Nunez J. Thyroid hormones and brain development. Eur J Endocrinol. 1995;133:390–398. - PubMed
- Bhat M K, Dace A, Cheng S-Y. Tissue-specific differential repression of gene expression by a dominant negative mutant of thyroid hormone β1 receptor. Thyroid. 1999;9:411–418. - PubMed
Publication types
MeSH terms
Substances
LinkOut - more resources
Full Text Sources
Other Literature Sources


