ErbB2, but not ErbB1, reinitiates proliferation and induces luminal repopulation in epithelial acini - PubMed (original) (raw)
ErbB2, but not ErbB1, reinitiates proliferation and induces luminal repopulation in epithelial acini
S K Muthuswamy et al. Nat Cell Biol. 2001 Sep.
Abstract
Both ErbB1 and ErbB2 are overexpressed or amplified in breast tumours. To examine the effects of activating ErbB receptors in a context that mimics polarized epithelial cells in vivo, we activated ErbB1 and ErbB2 homodimers in preformed, growth-arrested mammary acini cultured in three-dimensional basement membrane gels. Activation of ErbB2, but not that of ErbB1, led to a reinitiation of cell proliferation and altered the properties of mammary acinar structures. These altered structures share several properties with early-stage tumours, including a loss of proliferative suppression, an absence of lumen, retention of the basement membrane and a lack of invasive properties. ErbB2 activation also disrupted tight junctions and the cell polarity of polarized epithelia, whereas ErbB1 activation did not have any effect. Our results indicate that ErbB receptors differ in their ability to induce early stages of mammary carcinogenesis in vitro and this three-dimensional model system can reveal biological activities of oncogenes that cannot be examined in vitro in standard transformation assays.
Figures
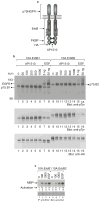
Figure 1. Synthetic-ligand-inducible activation of ErbB receptors in MCF-10A cells
a, A schematic representation of the synthetic ligand-induced dimer of chimaeric ErbB receptors. b, Anti-pTyr immunoblots of total cell lysates (top panel) or anti-HA immunoprecipitates (IP) (middle panel) from MCF-10A cells expressing either ErbB1 (10A.ErbB1) or ErbB2 (10A.ErbB2) receptor chimaeras before and after stimulation with EGF (ng ml−1) or AP1510 (nM). The blot in the middle panel was stripped and reprobed with anti-HA antibodies (bottom panel). c, AP1510- or EGF-induced changes in Erk2 kinase activity were measured with an in vitro kinase with MBP as the substrate. The kinase assay blot was reprobed with anti-Erk2 antibodies to determine the levels of Erk2 protein in kinase reactions.
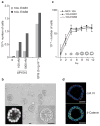
Figure 2. MCF-10A cells form growth arrested polarized acinar structures in Matrigel
a, Cells expressing different ErbB chimaeras were plated either in the presence of EGF or AP1510. Cell numbers were determined after 5 days. The graph represents an average of three experiments. b, Morphology of acinar structures formed by MCF-10A cells plated in Matrigel for 12 days. Phase image of an acinus at higher magnification is shown in the right inset. The acini were labelled with DAPI and a confocal image through the middle of an acinus is shown (left inset). c, Parental MCF-10A cells and cell lines expressing different ErbB chimaeras were plated on Matrigel and cell numbers were determined on the days indicated. The experiment was repeated three times. The acinar organization at different stages of morphogenesis was determined by confocal analysis of DAPI-labelled structures; the results are shown as diagrams within the graph. d, Day-12 acinar structures were immunostained for collagen IV (coll. IV) (red, upper panel) or β-catenin (green, lower panel) and simultaneously stained for nuclei (blue). Scale bars, 50 μm.
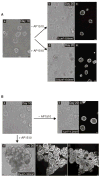
Figure 3. ErbB1 and ErbB2 homodimers differ in their ability to affect acinar structures
A, Cells expressing p75.B1 chimaera were grown in the absence of AP1510 for 10 days (a). The acinar structures were either maintained in the absence of AP1510 (b) or stimulated with 1 μM AP1510 (d) for an additional 10 days. The 20-day-old structures were stained with DAPI and confocal images were obtained (c, e). B, Cells expressing p75.B2 chimaera were left to form acinar structures in the absence of AP1510 for 10 days (a). Ten-day-old structures were either stimulated with AP1510 (d) or maintained in the absence of AP1510 (b). Confocal images of DAPI-labelled 20-day-old structures were obtained. c, An image of day-20 structures maintained in the absence of AP1510. e, f, Two serial optical sections along the z axis of one AP1510-induced multi-acinar structure. The sizes of at least 200 structures were measured with an ocular micrometer and the range is shown (Ab, Ad, Bb, Bd). Scale bars, 50 μm.
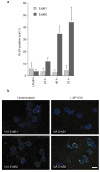
Figure 4. ErbB1 and ErbB2 homodimers differ in their ability to reinitiate proliferation
Twelve-day-old structures were stimulated with 1 μm AP1510 for 24, 48 or 72 h. Stimulated and unstimulated (unstim.) structures were fixed and immunostained with antibody against Ki-67. a, Percentages of acini expressing Ki-67 were quantified. At least 150 structures were counted for each experiment and the results are averages from two experiments. Error bars represent s.d. b, Representative fields of the Ki-67-immunostained acini from p75.B1 (upper panels) or p75.B2 expressing cells (lower panels). Scale bar, 50 μm.
Figure 5. Characterization of ErbB2-induced multi-acinar structures
Acinar structures grown in the absence of AP1510 were immunostained with monoclonal antibodies against α6 integrin (a, green) or collagen IV (b, red) and analysed with a confocal microscope. Optical sections through the middles of the acini are shown. The ErbB2-induced multi-acinar structures were immunostained with antiserum to α6 integrin (c, e, green), collagen IV (d, f, red), β-catenin (g, red) and laminin V (h, red). Representative confocal images are shown. Nuclei are coloured blue. Scale bars, 50 μm.
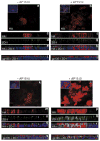
Figure 6. ErbB1 and ErbB2 homodimers differ in their ability to disrupt epithelial cell polarity
MDCK cells expressing p75.B1 (a–j) or p75.B2 (k–t) chimaeras were plated on 0.4-μm filters and stimulated with AP1510 as described in Methods. a, b, k, l, Anti-HA immunostaining of the cells expressing p75.B1 or p75.B2 grown in the absence (a, k) or presence (b, l) of AP1510. The inserts demonstrate that only some of the cells in the field express the ErbB chimaeras. Cells grown in the absence (c, d, e, i, p75.B1; m, n, o, s, p75.B2) or presence (f, g, h, j, p75.B1; p, q, r, t, p75.B2) of AP1510 were immunostained for anti-HA (c, f, m, p, red), anti-ZO-1 (d, g, n, q, green), or anti-gp135 (red) and anti-ZO-1 (green) (i, j, s, t) and analysed in the x_–_z axis. The image in e is a merged composite of images in c and d; h is a composite of f and g; o is composite of m and n, and r is a composite of p and q. Nuclei are coloured blue.
Similar articles
- Controlled dimerization of ErbB receptors provides evidence for differential signaling by homo- and heterodimers.
Muthuswamy SK, Gilman M, Brugge JS. Muthuswamy SK, et al. Mol Cell Biol. 1999 Oct;19(10):6845-57. doi: 10.1128/MCB.19.10.6845. Mol Cell Biol. 1999. PMID: 10490623 Free PMC article. - ERBB1 and ERBB2 have distinct functions in tumor cell invasion and intravasation.
Kedrin D, Wyckoff J, Boimel PJ, Coniglio SJ, Hynes NE, Arteaga CL, Segall JE. Kedrin D, et al. Clin Cancer Res. 2009 Jun 1;15(11):3733-9. doi: 10.1158/1078-0432.CCR-08-2163. Epub 2009 May 19. Clin Cancer Res. 2009. PMID: 19458057 Free PMC article. - Sequestration and segregation of receptor kinases in epithelial cells: implications for ErbB2 oncogenesis.
Carraway CA, Carraway KL. Carraway CA, et al. Sci STKE. 2007 Apr 10;2007(381):re3. doi: 10.1126/stke.3812007re3. Sci STKE. 2007. PMID: 17426346 Review. - The relative role of ErbB1-4 receptor tyrosine kinases in radiation signal transduction responses of human carcinoma cells.
Bowers G, Reardon D, Hewitt T, Dent P, Mikkelsen RB, Valerie K, Lammering G, Amir C, Schmidt-Ullrich RK. Bowers G, et al. Oncogene. 2001 Mar 15;20(11):1388-97. doi: 10.1038/sj.onc.1204255. Oncogene. 2001. PMID: 11313882 Review.
Cited by
- Three-dimensional culture of human breast epithelial cells: the how and the why.
Vidi PA, Bissell MJ, Lelièvre SA. Vidi PA, et al. Methods Mol Biol. 2013;945:193-219. doi: 10.1007/978-1-62703-125-7_13. Methods Mol Biol. 2013. PMID: 23097109 Free PMC article. - The nuclear coactivator amplified in breast cancer 1 maintains tumor-initiating cells during development of ductal carcinoma in situ.
Ory V, Tassi E, Cavalli LR, Sharif GM, Saenz F, Baker T, Schmidt MO, Mueller SC, Furth PA, Wellstein A, Riegel AT. Ory V, et al. Oncogene. 2014 Jun 5;33(23):3033-42. doi: 10.1038/onc.2013.263. Epub 2013 Jul 15. Oncogene. 2014. PMID: 23851504 Free PMC article. - Flow induces epithelial-mesenchymal transition, cellular heterogeneity and biomarker modulation in 3D ovarian cancer nodules.
Rizvi I, Gurkan UA, Tasoglu S, Alagic N, Celli JP, Mensah LB, Mai Z, Demirci U, Hasan T. Rizvi I, et al. Proc Natl Acad Sci U S A. 2013 May 28;110(22):E1974-83. doi: 10.1073/pnas.1216989110. Epub 2013 May 3. Proc Natl Acad Sci U S A. 2013. PMID: 23645635 Free PMC article. - FOXC2 expression links epithelial-mesenchymal transition and stem cell properties in breast cancer.
Hollier BG, Tinnirello AA, Werden SJ, Evans KW, Taube JH, Sarkar TR, Sphyris N, Shariati M, Kumar SV, Battula VL, Herschkowitz JI, Guerra R, Chang JT, Miura N, Rosen JM, Mani SA. Hollier BG, et al. Cancer Res. 2013 Mar 15;73(6):1981-92. doi: 10.1158/0008-5472.CAN-12-2962. Epub 2013 Feb 1. Cancer Res. 2013. PMID: 23378344 Free PMC article. - The intracellular domain of ErbB4 induces differentiation of mammary epithelial cells.
Muraoka-Cook RS, Sandahl M, Husted C, Hunter D, Miraglia L, Feng SM, Elenius K, Earp HS 3rd. Muraoka-Cook RS, et al. Mol Biol Cell. 2006 Sep;17(9):4118-29. doi: 10.1091/mbc.e06-02-0101. Epub 2006 Jul 12. Mol Biol Cell. 2006. PMID: 16837552 Free PMC article.
References
- Petersen OW, Ronnov-Jessen L, Howlett AR, Bissell MJ. Interaction with basement membrane serves to rapidly distinguish growth and differentiation pattern of normal and malignant human breast epithelial cells. Proc Natl Acad Sci USA. 1992;89:9064–9068. (Erratum, Proc. Natl Acad. Sci. USA90, 2556 (1993).) - PMC - PubMed
- Harris J, Lippman M, Morrow M, Osborne C. Diseases of the Breast. Lippincott Williams and Wilkins; Philadelphia: 1999.
- Riese DJ, 2nd, Stern DF. Specificity within the EGF family/ErbB receptor family signaling network. BioEssays. 1998;20:41–48. - PubMed
Publication types
MeSH terms
Substances
Grants and funding
- U54 CA143836/CA/NCI NIH HHS/United States
- U54 CA126552/CA/NCI NIH HHS/United States
- U54 CA112970/CA/NCI NIH HHS/United States
- R01 CA057621/CA/NCI NIH HHS/United States
- U01 CA143233/CA/NCI NIH HHS/United States
- R01 CA064786/CA/NCI NIH HHS/United States
LinkOut - more resources
Full Text Sources
Other Literature Sources
Research Materials
Miscellaneous
