Cell contact-dependent immunosuppression by CD4(+)CD25(+) regulatory T cells is mediated by cell surface-bound transforming growth factor beta - PubMed (original) (raw)
Cell contact-dependent immunosuppression by CD4(+)CD25(+) regulatory T cells is mediated by cell surface-bound transforming growth factor beta
K Nakamura et al. J Exp Med. 2001.
Abstract
CD4(+)CD25(+) T cells have been identified as a population of immunoregulatory T cells, which mediate suppression of CD4(+)CD25(-) T cells by cell-cell contact and not secretion of suppressor cytokines. In this study, we demonstrated that CD4(+)CD25(+) T cells do produce high levels of transforming growth factor (TGF)-beta1 and interleukin (IL)-10 compared with CD4(+)CD25(-) T cells when stimulated by plate-bound anti-CD3 and soluble anti-CD28 and/or IL-2, and secretion of TGF-beta1 (but not other cytokines), is further enhanced by costimulation via cytotoxic T lymphocyte-associated antigen (CTLA)-4. As in prior studies, we found that CD4(+)CD25(+) T cells suppress proliferation of CD4(+)CD25(-) T cells; however, we observed here that such suppression is abolished by the presence of anti-TGF-beta. In addition, we found that CD4(+)CD25(+) T cells suppress B cell immunoglobulin production and that anti-TGF-beta again abolishes such suppression. Finally, we found that stimulated CD4(+)CD25(+) T cells but not CD4(+)CD25(-) T cells express high and persistent levels of TGF-beta1 on the cell surface. This, plus the fact that we could find no evidence that a soluble factor mediates suppression, strongly suggests that CD4(+)CD25(+) T cells exert immunosuppression by a cell-cell interaction involving cell surface TGF-beta1.
Figures
Figure 1
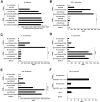
Proliferation and cytokine production of CD4+CD25+ regulatory T cells are CD28 and IL-2 dependent. (A) 2.5 × 10⁴ CD4+CD25+ or CD4+CD25− cells were stimulated with plate-bound anti-CD3 Ab (10 μg/ml) with or without soluble anti-CD28 Ab (2 μg/ml) and/or exogenous IL-2 (20 U/ml) in 96-well plates. Cell proliferation was measured by incorporation of [3H]thymidine after 72 h. The results shown represent the mean ± SEM of triplicate wells and representative of three independent experiments. (B–E) 105 CD4+CD25+ or CD4+CD25− cells were stimulated with plate-bound anti-CD3 Ab (10 μg/ml) with or without soluble anti-CD28 Ab (2 μg/ml) and/or exogenous IL-2 (20 U/ml) in 100 μl culture. The amount of TGF-β1 (B), IL-10 (C), IL-4 (D), and IFN-γ (E) in culture supernatant was measured by ELISA. In B, 1% Nutridoma/RPMI was used for culture media. The results shown represent the mean ± SEM of triplicate wells with each well measured in duplicate, and are representative of three independent experiments. n.d., not detected, *: P < 0.00007, **: P < 0.0002, ***: P < 0.0009, ****: P < 0.0008. (F) 105 CD4+CD25+ or CD4+CD25− cells were stimulated with soluble anti-CD3 Ab (10 μg/ml), 2 × 10⁵ irradiated non–T cells and IL-2 (20 U/ml) in 100 μl culture. 2.5% FCS/RPMI was used for culture media and TGF-β1 content in media was subtracted as a background. The results shown represent the mean ± SEM of triplicate wells with each well measured in duplicate, and are representative of three independent experiments.
Figure 2
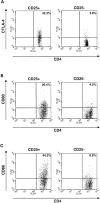
Expression of CTLA-4, CD80, and CD86 on CD4+CD25+ T cells. (A) CTLA-4 on/in splenocytes was stained as described in Materials and Methods. CD4+CD25+ and CD4+CD25− fractions were gated and expression of CTLA-4 on/in each population is shown. (B and C) Purified CD4+CD25+ and CD4+CD25− T cells were stimulated with anti-CD3 (10 μg/ml), irradiated non–T cells and IL-2 (20 U/ml) for 72 h and then stained with Cy-chrome™–conjugated anti-CD4 and either of PE-conjugated anti-CD80 or PE-conjugated anti-CD86. Expression of CD80 (B) and CD86 (C) in the CD4+ gate is shown.
Figure 3
Signaling through CTLA-4 enhances proliferation and TGF-β1 secretion of CD4+CD25+ T cells. (A) 2.5 × 10⁴ CD4+CD25+ or CD4+CD25− T cells were stimulated with plate-bound anti-CD3 with or without soluble anti-CD28 (2 μg/ml), plate-bound anti–CTLA-4, or exogenous IL-2 (20 U/ml) in 96-well plates. Cell proliferation was measured by incorporation of [3H]thymidine after 72 h. Plates were coated either with anti-CD3 (10 μg/ml) plus anti–CTLA-4 (15 μg/ml) or anti-CD3 plus hamster IgG (15 μg/ml). The results shown are the mean ± SEM of triplicate wells and representative of three independent experiments. (B and C) 105 CD4+CD25+ or CD4+CD25− T cells were stimulated with plate-bound anti-CD3 Ab, soluble anti-CD28 Ab (2 μg/ml), and exogenous IL-2 (20 U/ml) with or without plate-bound anti–CTLA-4 in 100 μl of culture. The amount of TGF-β1 (B) and IL-10 (C) was measured by ELISA. In B, 1% Nutridoma/RPMI was used for culture media. Plates were coated either with anti-CD3 (10 μg/ml) plus anti–CTLA-4 (10 μg/ml) or anti-CD3 plus hamster IgG (10 μg/ml). The results shown are the mean ± SEM of triplicate wells with each well measured in duplicate, and are representative of three independent experiments. n.d., not detected, *: P < 0.005, **: P < 0.00003.
Figure 4
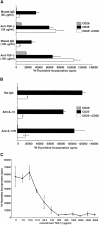
Suppression of T cell proliferation by CD4+CD25+ regulatory T cells is mediated by TGF-β. (A and B) 2.5 × 10⁴ CD4+CD25− (black bars) or CD4+CD25+ T cells (hatched bars), or both (white bars) were stimulated with soluble anti-CD3 Ab (10 μg/ml) and 5 × 10⁴ of irradiated syngenic non–T cells in 96-well plates in the presence of anti-cytokine or control IgG. (A) 50 μg/ml or 100 μg/ml of control mouse IgG or anti-TGF-β (1D11). (B) 100 μg/ml of control rat IgG, anti–IL-10, or anti–IL-10R. Cell proliferation was measured by incorporation of [3H]thymidine after 72 h. The results shown are the mean ± SEM of triplicate wells and are representative of four independent experiments. (C) 2.5 × 10⁴ CD4+CD25− T cells were stimulated with soluble anti-CD3 Ab (10 μg/ml) and 5 × 10⁴ of irradiated syngenic non–T cells in 96-well plates in the presence of various amounts of rTGF-β1 (active form). Cell proliferation was measured by incorporation of [3H]thymidine after 72 h. The results shown are the mean ± SEM of triplicate wells and are representative of three independent experiments.
Figure 5
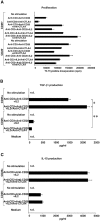
CD4+CD25+ regulatory T cells suppress B cell Ig synthesis through TGF-β. (A) 5 × 10⁴ CD4+CD25− or CD4+CD25+ T cells, plus 5 × 10⁴ non–T cells were stimulated with 20 μg/ml of PWM and 20 U/ml of IL-2 in 200 μl culture. In some wells, CD4+CD25+ cells were added to 5 × 10⁴ CD4+CD25− cells at the ratio indicated in the figure. Cells were cultured at 37°C for 8 d and culture supernatant was collected. The concentration of mouse IgG in the supernatant was determined by ELISA. The results shown are the mean ± SEM of triplicate wells and are representative of three independent experiments. (B) 5 × 10⁴ CD4+CD25− (black bars), or 5 × 10⁴ of both CD4+CD25+ and CD4+CD25− T cells (white bars) were cocultured with 5 × 10⁴ non–T cells, and stimulated with 20 μg/ml of PWM and 20 U/ml of IL-2 in 200 μl culture. 20 μg/ml of control chicken IgG or chicken anti–TGF-β1 Ab, or 100 μg/ml of rat anti–IL-10 mAb was added to the culture. Cells were cultured at 37°C for 8 d and culture supernatant was collected. Concentration of mouse IgG in the supernatant was determined by ELISA. The results shown are the mean ± SEM of triplicate wells and representative of three independent experiments.
Figure 6
CD4+CD25+ T cells express TGF-β1 on the cell surface. (A) Enriched CD4+ T cells were stained with FITC-conjugated anti-CD25, Cy-Chrome™–conjugated anti-CD4 and either biotin-conjugated chicken anti–TGF-β1 or biotin-conjugated normal chicken IgG, washed, and stained with PE-conjugated streptavidin. CD4+CD25+ and CD4+CD25− T cells were gated and expression of cell surface-bound TGF-β1 is shown. Thick lines: anti–TGF-β, thin lines: normal chicken IgG. The results shown are the representative of three independent experiments. (B and C) Purified CD4+CD25+ and CD4+CD25− T cells were stimulated with soluble anti-CD3 (10 μg/ml) and irradiated non–T cells in the presence of IL-2 (20 U/ml) for 24 h (B) or 6 d (C). Cells were then stained with Cy-Chrome™–conjugated anti-CD4 and either biotin-conjugated chicken anti–TGF-β1 or biotin-conjugated normal chicken IgG, washed and stained with PE-conjugated streptavidin. CD4+ cells were gated and expression of cell surface-bound TGF-β1 is shown. Thick lines: anti–TGF-β, thin lines: normal chicken IgG. The results shown are the representative of three independent experiments. (D) Graphic representation of the percentage of surface TGF-β1 positive cells in CD4+CD25+ (circle) and CD4+CD25− (triangle) T cells after stimulation.
Figure 7
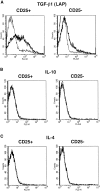
CD4+CD25+ T cells express LAP of TGF-β1 but not IL-10 or IL-4 on the cell surface. Purified CD4+CD25+ and CD4+CD25− T cells were stimulated with soluble anti-CD3 (10 μg/ml) and irradiated non–T cells in the presence of IL-2 (20 U/ml) for 24 h. Cells were incubated with Cy-Chrome™–conjugated anti-CD4 and either anti-LAP mAB (27232.11) (A), PE-conjugated anti–IL-10 (B), or PE-conjugated anti–IL-4 (C). Incubation with isotype-matched control IgG for each anti-cytokine was performed in parallel. In panel A, after incubation with anti-LAP, cells were washed, incubated with biotin-conjugated anti–mouse IgG1, washed, and incubated with PE-conjugated streptavidin. CD4+ cells were gated and expression of LAP (A), IL-10 (B), and IL-4 (C) on the cell surface was shown. Thick lines: anti-cytokine; thin lines: isotype-matched control IgG.
Figure 8
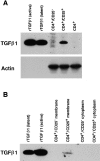
Immunoblot analyses for the expression of TGF-β1 in CD4+CD25+ T cells. (A) Total cell lysates purified from 3 × 10⁶ of activated CD4+CD25−, CD4+CD25+ and CD4+ T cells were run in SDS/PAGE and blotted to the membrane. 5 ng of active and latent rTGF-β1 were loaded in parallel to serve as positive controls. Membrane was first probed using chicken anti–TGF-β1, stripped, and reprobed with anti-actin Ab. (B) Lysates from membrane (derived from 2.5 × 10⁷ cells) and cytoplasmic (derived from 1.25 × 10⁷ cells) preparations of activated CD4+CD25− and CD4+CD25+ T cells were subjected to SDS/PAGE and immunoblot analysis. Membrane was probed using chicken anti–TGF-β1.
Figure 9
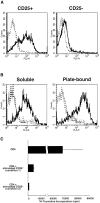
Expression of surface TGF-β1 after the stimulation with plate-bound anti-CD3 and anti–CTLA-4, soluble anti-CD28, and IL-2. (A) Purified CD4+CD25+ and CD4+CD25− T cells were stimulated with plate-bound anti-CD3 (10 μg/ml) and anti–CTLA-4 (10 μg/ml), soluble anti-CD28 (2 μg/ml), and IL-2 (20 U/ml). Cultures were carried out in 1% Nutridoma/RPMI. 24 h later, cells were incubated with Cy-Chrome™–conjugated anti-CD4 and either biotin-conjugated chicken anti–TGF-β1 or biotin-conjugated normal chicken IgG, washed, and stained with PE-conjugated streptavidin. CD4+ cells were gated and expression of cell surface-bound TGF-β1 is shown. Thick lines: anti–TGF-β; thin lines: normal chicken IgG. (B) Purified CD4+CD25+ T cells were stimulated with soluble anti-CD3 (10 μg/ml), non–T cells and IL-2 (20 U/ml) (left panel), or with plate-bound anti-CD3 (10 μg/ml) and anti–CTLA-4 (10 μg/ml), soluble anti-CD28 (2 μg/ml), and IL-2 (20 U/ml) (right panel). 60 h later, cells were incubated with Cy-Chrome™–conjugated anti-CD4 and either biotin-conjugated chicken anti–TGF-β1 or biotin-conjugated normal chicken IgG, washed, and stained with PE-conjugated streptavidin. CD4+ cells were gated and expression of cell surface-bound TGF-β1 is shown. Thick lines: anti–TGF-β; thin lines: normal chicken IgG. (C) Purified CD4+CD25+ T cells were stimulated with soluble anti-CD3 (10 μg/ml), non–T cells and IL-2 (20 U/ml) (condition 1) or with plate-bound anti-CD3 (10 μg/ml) and anti–CTLA-4 (10 μg/ml), soluble anti-CD28 (2 μg/ml), and IL-2 (20 U/ml) (condition 2) for 4 d and irradiated (1,000 rad). 2.5 × 10⁴ CD4+ T cells were mixed with 2.5 × 10⁴ CD4+CD25+ T cells stimulated in condition 1 or condition 2, and stimulated with soluble anti-CD3 Ab (10 μg/ml) and 5 × 10⁴ of irradiated syngenic non–T cells in 96-well plates. Cell proliferation was measured by incorporation of [3H]thymidine after 72 h. The results shown are the mean ± SEM of triplicate wells and are representative of two independent experiments.
Figure 10
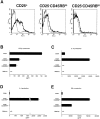
Comparison of cytokine expression among CD25+, CD25−CD45RBlow and CD25−CD45RBhigh populations of CD4+ T cells. (A) Purified CD4+CD25+, CD4+CD25− CD45RBlow and CD4+CD25−CD45RBhigh T cells were stimulated with plate-bound anti-CD3 (10 μg/ml) and anti–CTLA-4 (10 μg/ml), soluble anti-CD28 (2 μg/ml), and IL-2 (20 U/ml). 24 h later, cells were incubated with either biotin-conjugated chicken anti–TGF-β1 or biotin-conjugated normal chicken Ig G, washed, and stained with Cy-Chrome™–conjugated streptavidin. Expression of cell surface–bound TGF-β1 is shown. Thick lines: anti–TGF-β; thin lines: normal chicken IgG. (B–E) 105 CD4+ CD25+, CD4+ CD25−CD45RBlow and CD4+ CD25−CD45RBhigh T cells were stimulated with plate-bound anti-CD3 (10 μg/ml) and anti–CTLA-4 (10 μg/ml), soluble anti-CD28 (2 μg/ml) and IL-2 (20 U/ml) in 100 μl culture for 72 h. The amount of TGF-β1 (B), IL-10 (C), IL-4 (D), and IFN-γ (E) in culture supernatant was measured by ELISA. In B, 1% Nutridoma/RPMI was used for culture media. The results shown represent the mean ± SEM of triplicate wells with each well measured in duplicate. n.d., not detected.
Similar articles
- CD4(+)CD25(+) regulatory T cells can mediate suppressor function in the absence of transforming growth factor beta1 production and responsiveness.
Piccirillo CA, Letterio JJ, Thornton AM, McHugh RS, Mamura M, Mizuhara H, Shevach EM. Piccirillo CA, et al. J Exp Med. 2002 Jul 15;196(2):237-46. doi: 10.1084/jem.20020590. J Exp Med. 2002. PMID: 12119348 Free PMC article. - Acquisition of anergic and suppressive activities in transforming growth factor-beta-costimulated CD4+CD25- T cells.
Park HB, Paik DJ, Jang E, Hong S, Youn J. Park HB, et al. Int Immunol. 2004 Aug;16(8):1203-13. doi: 10.1093/intimm/dxh123. Epub 2004 Jul 5. Int Immunol. 2004. PMID: 15237111 - Dendritic cells partially abrogate the regulatory activity of CD4+CD25+ T cells present in the human peripheral blood.
Ahn JS, Krishnadas DK, Agrawal B. Ahn JS, et al. Int Immunol. 2007 Mar;19(3):227-37. doi: 10.1093/intimm/dxl139. Epub 2007 Feb 7. Int Immunol. 2007. PMID: 17289657 - Regulatory T cells generated ex vivo as an approach for the therapy of autoimmune disease.
Horwitz DA, Zheng SG, Gray JD, Wang JH, Ohtsuka K, Yamagiwa S. Horwitz DA, et al. Semin Immunol. 2004 Apr;16(2):135-43. doi: 10.1016/j.smim.2003.12.009. Semin Immunol. 2004. PMID: 15036237 Review. - Control of T-cell activation by CD4+ CD25+ suppressor T cells.
Shevach EM, McHugh RS, Piccirillo CA, Thornton AM. Shevach EM, et al. Immunol Rev. 2001 Aug;182:58-67. doi: 10.1034/j.1600-065x.2001.1820104.x. Immunol Rev. 2001. PMID: 11722623 Review.
Cited by
- A Novel Subset of Regulatory T Cells Induced by B Cells Alleviate the Severity of Immunological Diseases.
Chu KH, Chiang BL. Chu KH, et al. Clin Rev Allergy Immunol. 2024 Dec;67(1-3):73-82. doi: 10.1007/s12016-024-09009-y. Epub 2024 Oct 28. Clin Rev Allergy Immunol. 2024. PMID: 39465485 Review. - Tregs in transplantation tolerance: role and therapeutic potential.
Cassano A, Chong AS, Alegre ML. Cassano A, et al. Front Transplant. 2023 Aug 30;2:1217065. doi: 10.3389/frtra.2023.1217065. eCollection 2023. Front Transplant. 2023. PMID: 38993904 Free PMC article. Review. - CD69 is the crucial regulator of intestinal inflammation: a new target molecule for IBD treatment?
Radulovic K, Niess JH. Radulovic K, et al. J Immunol Res. 2015;2015:497056. doi: 10.1155/2015/497056. Epub 2015 Feb 22. J Immunol Res. 2015. PMID: 25759842 Free PMC article. Review. - Neonatal regulatory T cells have reduced capacity to suppress dendritic cell function.
Rueda CM, Moreno-Fernandez ME, Jackson CM, Kallapur SG, Jobe AH, Chougnet CA. Rueda CM, et al. Eur J Immunol. 2015 Sep;45(9):2582-92. doi: 10.1002/eji.201445371. Epub 2015 Jun 25. Eur J Immunol. 2015. PMID: 26046326 Free PMC article. - Paracrine co-delivery of TGF-β and IL-2 using CD4-targeted nanoparticles for induction and maintenance of regulatory T cells.
McHugh MD, Park J, Uhrich R, Gao W, Horwitz DA, Fahmy TM. McHugh MD, et al. Biomaterials. 2015 Aug;59:172-81. doi: 10.1016/j.biomaterials.2015.04.003. Epub 2015 May 15. Biomaterials. 2015. PMID: 25974747 Free PMC article.
References
- Sakaguchi S. Regulatory T cellskey controllers of immunologic self-tolerance. Cell. 2000;101:455–458. - PubMed
- Powrie F., Leach M.W., Mauze S., Caddle L.B., Coffman R.L. Phenotypically distinct subsets of CD4+ T cells induce or protect from chronic intestinal inflammation in C. B-17 scid mice. Int. Immunol. 1993;5:1461–1471. - PubMed
MeSH terms
Substances
LinkOut - more resources
Full Text Sources
Other Literature Sources
Research Materials
