FM1-43 dye behaves as a permeant blocker of the hair-cell mechanotransducer channel - PubMed (original) (raw)
FM1-43 dye behaves as a permeant blocker of the hair-cell mechanotransducer channel
J E Gale et al. J Neurosci. 2001.
Abstract
Hair cells in mouse cochlear cultures are selectively labeled by brief exposure to FM1-43, a styryl dye used to study endocytosis and exocytosis. Real-time confocal microscopy indicates that dye entry is rapid and via the apical surface. Cooling to 4 degrees C and high extracellular calcium both reduce dye loading. Pretreatment with EGTA, a condition that breaks tip links and prevents mechanotransducer channel gating, abolishes subsequent dye loading in the presence of calcium. Dye loading recovers after calcium chelation with a time course similar to that described for tip-link regeneration. Myo7a mutant hair cells, which can transduce but have all mechanotransducer channels normally closed at rest, do not label with FM1-43 unless the bundles are stimulated by large excitatory stimuli. Extracellular perfusion of FM1-43 reversibly blocks mechanotransduction with half-blocking concentrations in the low micromolar range. The block is reduced by high extracellular calcium and is voltage dependent, decreasing at extreme positive and negative potentials, indicating that FM1-43 behaves as a permeant blocker of the mechanotransducer channel. The time course for the relief of block after voltage steps to extreme potentials further suggests that FM1-43 competes with other cations for binding sites within the pore of the channel. FM1-43 does not block the transducer channel from the intracellular side at concentrations that would cause complete block when applied extracellularly. Calcium chelation and FM1-43 both reduce the ototoxic effects of the aminoglycoside antibiotic neomycin sulfate, suggesting that FM1-43 and aminoglycosides enter hair cells via the same pathway.
Figures
Fig. 1.
Selective labeling of hair cells in cochlear cultures with FM1-43. A, Low-magnification fluorescent image of a 2-d-old basal-coil cochlear culture taken 30 min after a 10 sec exposure to 3 μ
m
FM1-43. B, Image of a 2-d-old apical-coil cochlear culture taken 35 min after a 10 sec exposure to 3 μ
m
FM1-43. FM1-43 labels hair cells, whereas the surrounding supporting cells do not load with the dye. A gradient in the amount of dye loading can be seen running from the hair cells at the basal, more mature end of the apical coil (left in B) to those at the apical end (right in B). In both A_and B, some cells within the neural tissue in the center of the culture appear to have loaded with the dye. C,D, At higher magnification, differences in the dye loading of inner and outer hair cells can be seen in both the basal-coil culture (C) and the basal end of the apical-coil culture (D). Outer hair cells load more dye than inner hair cells after a 10 sec bath application of the dye. E, Hair cells at the apical end of the apical coil load less dye than those at the basal end. At the apical end, the inner and outer hair cells load equivalent amounts of the dye. In_C_–_E, the single row of inner hair cells lies below the three rows of outer hair cells. Scale bars:A, B, 250 μm;C_–_E, 25 μm.
Fig. 2.
Time course of dye loading revealed by confocal microscopy. A, A series of images taken at the time points indicated at the three focal levels,L1, L2, and L3 indicated in B. The vertical arrow indicates the onset of dye application (6 μ
m
lasting for 5 sec). The frame is an area measuring 80 × 55 μm. The top row, L1, shows consecutive images of the “v”-shaped bundles of stereocilia at the surface of the hair cells in which a transient peak of dye labeling is observed. The_middle row_, L2, shows consecutive images taken at a focal plane close to the cuticular plate at the apical pole of the cell. Dye loads into this region rapidly and is then retained. The bottom row, L3, shows images taken at the level of the cell nucleus. Note the absence of fluorescence in the nucleus, presumably caused by the lack of membrane-bound organelles. It can be seen that dye enters the apex of the cell before being visualized at the level of the nucleus. The approximate time is indicated in seconds. B, Schematic diagram showing the three focal planes at which the ZT series were captured and the approximate position of the puffer pipette used to apply 6 μ
m
FM1-43 for 5 sec. C, The change in fluorescence at the three focal levels as a function of time (adjusted for the interval between frame capture at each level) in a basal-coil outer hair cell. The graph shows that dye partitions into the outer leaflet of the stereocilia and then departitions (L1). Dye is then observed at the level of the cuticular plate (L2) and is subsequently seen at the level of the cell nucleus, close to the base of the cell (L3).D, Confocal image taken 30 min after exposure to the dye. At this time point the dye is observed in punctate structures within the cytoplasm of the cell. Scale bar, 5 μm.E, Comparison of dye loading in apical (▴) and basal-coil (▪) outer hair cells. Images were captured at a single focal plane, 7.5 μm below the apex. The interval between frames is 0.85 sec. The changes in fluorescence were normalized and have been fitted with a sigmoidal (Boltzmann) function with_t_1/2 max values of 10.0 sec for basal-coil and 20.1 sec for apical-coil outer hair cells.
Fig. 3.
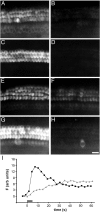
Effects of cooling, elevated extracellular calcium, and calcium chelation on FM1-43 loading. All images were captured from basal-coil hair cells 6–8 min after bath application of 3 μ
m
FM1-43 for 10 sec. The images shown in_A_, C, E, and_G_ are from the corresponding age and time-matched controls for the images shown in B, D,F, and H, respectively. A,B, Dye loading at room temperature (A) and at 4°C (B). Labeling is blocked when the dye is applied at low temperature.C, D, Cultures preincubated and exposed to dye in the presence of HBHBSS (C) and preincubated and exposed to dye in the presence of HBHBSS containing 10 m
m
calcium (D). Labeling is blocked when the dye is applied in HBHBSS with 10 m
m
calcium.E, F, Dye loading in normal HBHBSS (E) and HBHBSS containing 5 m
m
EGTA (F). Labeling is slightly reduced when dye is applied in HBHBSS containing EGTA. G, H, Dye loading in cultures preincubated for 15 min in HBHBSS (G) or HBHBSS containing 5 m
m
EGTA (H) before FM1-43 dye application in the presence of normal extracellular calcium. Labeling is substantially reduced by the 15 min pretreatment with EGTA. Occasional, solitary, dye-labeled hair cells observed in EGTA-treated cultures (∼2–5 per culture) are considered to be damaged cells. Scale bars (shown in H for_A_–H): 25 μm. I, The change in fluorescence measured in sham-treated control cultures at two confocal planes, one at the level of the stereocilia (▪) and the other at a level 10 μm lower (▴), during and after a 5 sec puff application of 6 μ
m
FM1-43. The signal at the level of the stereocilia (▪) is a difference signal obtained by subtraction of the mean fluorescence signal in time and age-matched EGTA-treated cultures (obtained 45 min after a 15 min treatment with 5 m
m
EGTA) from the mean signal recorded in the sham-treated control cultures. Images were obtained consecutively, and the time base has been adjusted for the interval between frame capture at each level. Data sets from control and EGTA-treated cultures contained samples from 21 hair cells in four different cultures and 30 hair cells in eight different cultures, respectively.
Fig. 4.
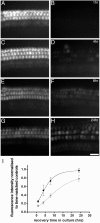
Recovery of FM1-43 dye loading after calcium chelation. A, C, E,G, Images of control, HBHBSS-treated basal-coil cultures after 1, 4, 8, and 24 hr, respectively. Images were captured 10 min after a 10 sec bath application of 3 μ
m
FM1-43.B, D, F, H, Images of basal-coil cultures incubated in HBHBSS containing 5 m
m
EGTA for 15 min and then returned to normal calcium containing culture medium for 1, 4, 8, and 24 hr (as indicated). Images were captured 10 min after a 10 sec bath application of 3 μ
m
FM1-43. Scale bar (shown in H for_A_–H): 25 μm. I, Quantitative assessment of FM1-43 loading. Data are pooled from a minimum of three cultures at each time point. Dye loading recovers to control levels over a 24 hr period. Apical-coil hair cells (●) recover to 95% of control. Basal-coil hair cells (▪) recover more slowly to 80% of control values over this time period. Data for both apical- and basal-coil cultures were fitted with an exponential growth function (fraction of control value = A +B_[1 − exp(−_t/τ)]n) with three unconstrained variables: A, the fraction of dye loading remaining after calcium chelation; B, the increase in dye loading during the time period; and τ, the time constant, as described by Zhao et al. (1996). For _n_= 2, fit parameters for apical-coil and basal-coil cells are as follows: for A, 0.22 and 0.14, for B, 0.74 and 0.76, and for τ, 4.5 and 9.6 hr, respectively.
Fig. 5.
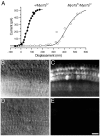
Failure of homozygous_Myo7a_ 6J hair cells to load with FM1-43. A, Relationship between maximum transducer current at −84 mV during a 50 msec force step and hair bundle displacement in heterozygous (P1 culture, 3 d in vitro) and homozygous (P1 culture, 2 d in vitro) Myo7a6J outer hair cells. Note that this relationship is shifted to the right in the homozygote, so that no current is activated in the unstimulated bundle.B, D, DIC images from the basal coil of cochlear cultures (P2 cultures, 1 d in vitro) from a heterozygous Myo7a6J mouse (B) and a homozygous_Myo7a6J_ mouse (D) showing the normal arrangement of the three rows of outer and one row of inner hair cells in both cases.C, E, Images taken 6 min after a 10 sec bath application of 3 μ
m
FM1-43. The heterozygous hair cells (C) load with the dye, whereas the homozygous hair cells (E) fail to load. Scale bar (shown in E for B_–_E): 25 μm.
Fig. 6.
Loading of 3 μ
m
FM1-43 in homozygous_Myo7a_ 4626SB hair cells during hair-bundle stimulation. A, C,E, DIC images showing the stimulating pipette placed close to homozygous MyoVIIA4626SB_outer (A, C) and inner (E) hair cells before hair bundle stimulation. The hair bundles were stimulated by fluid flow from the stimulating pipette using alternating, 2 sec inhibitory and excitatory step stimuli for a period of 60 sec. B, D,F, At the end of the stimulation period a fluorescent image was captured at a focal plane 10 μm below the cell surface. A significant increase in the fluorescent signal is observed in the cells that were stimulated. There is also a noticeable signal in some of the hair cells immediately surrounding the stimulating pipette, whereas cells more remote to the pipette do not load with the dye. Scale bar (shown in F for_A_–_F): 25 μm.
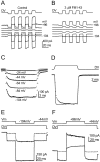
Fig. 7.
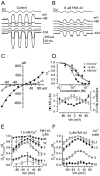
Block of mechanotransduction currents by extracellular FM1-43. A, Mechano-electrical transducer currents in a P5 outer hair cell elicited by sinusoidal fluid-jet stimulation at 45 Hz. Driver voltage (DV) to the jet (25 V amplitude) is shown above the currents. The membrane potential was stepped between −104 and +96 mV in 20 mV increments from a holding potential of −84 mV. For clarity, only responses to every other voltage step are shown. All records are single traces and are offset so that the zero-transducer current levels (responses to inhibitory stimuli) are equally spaced.B, Superfusion with 6 μ
m
FM1-43 rapidly reduced the transducer currents. Note that more current is shut off in response to the inhibitory phase of the sinusoid at −104 mV, pointing to an increase in the resting transducer current caused by the dye at this potential. C, Current–voltage curves for the peak-to-peak transducer currents recorded for the cell in_A_ and B. The fits through the data are according to a simple single-energy-barrier model:I(V) =k [exp ((1 −γ)(V −_V_r)/V_s) − exp (−_γ(V -_V_r)/_V_s)], where k is a proportionality constant,_V_r is the reversal potential,_V_s is a measure for the steepness of the rectification, and γ is the fractional distance within the membrane's electrical field of an energy barrier, as measured from the outside. (●) k = 112 pA,_V_r = 8.6 mV,_V_s = 27 mV, and γ = 0.52; (○) k = 4 pA,_V_r = −7.0 mV,_V_s = 13 mV, and γ = 0.54. _C_m, 5.8 pF;_R_s, 4.2 MΩ; 24°C.D, Dose–response curves for block of transducer currents by FM1-43 at three different membrane potentials (top panel). The data were fitted with a logistic curve:I/_I_C = 1/(1 + ([D]/_K_d)_n_H), where I is the current in the presence of the dye,_I_C is the control current,_K_d = 2.4 ± 0.3 μ
m
(○); 1.2 ± 0.1 μ
m
(●); 3.0 ± 0.3 μ
m
(▴)._n_H (Hill coefficient) = 1.2 ± 0.2 μ
m
(○); 2.2 ± 0.3 μ
m
(●); 1.2 ± 0.2 μ
m
(▴). Bottom panel, _K_d and_n_H both vary significantly as a function of voltage (p < 0.0001, ANOVA). E, Voltage dependence of the block of FM1-43 in the presence of 1.3 m
m
extracellular calcium. The ordinate represents fractional block, from 0 (no block) to 1 (complete block). For_D_, E: 0.3, 1, and 2 μ
m
, n = 3; 3 μ
m
, n = 8; 6 μ
m
, n = 4; 10 μ
m,
n = 2; 20 μ
m
, n = 1. F, Calcium sensitivity of block of the transducer currents by 3 μ
m
FM1-43. For 0.1 m
m
Ca2+, n = 3; 1.3 m
m
, n = 8; 5 m
m
,n = 5; 10 m
m
,n = 2.
Fig. 8.
Kinetics of mechanotransduction block by 3 μ
m
FM1-43. A, Transducer currents in a P7 outer hair cell in response to a series of saturating excitatory and inhibitory steps of 11 msec duration. Driver voltage (±25 V) shown above the traces. The membrane potential was stepped between −104 and +96 mV in 20 mV increments from a holding potential of −84 mV. For clarity, only every other trace is shown. Current recordings are averages of three stimulus presentations and are offset so that zero-transducer current levels are equally spaced. B, Currents in the same cell in the presence of FM1-43, averaged from seven stimuli. Driver voltage ±25 V. C, Single-exponential fits to responses to excitatory steps between −24 and −104 mV. Same experiment as in B, but all recorded voltage levels are shown. Responses to the four repetitions of the excitatory steps were superimposed and averaged. Time constants of the fits at the different potentials are as follows: −24 mV, 1.31 msec; −44 mV, 1.11 msec; −64 mV, 0.88 msec; −84 mV, 0.66 msec; −104 mV, 0.51 msec. _C_m, 6.7 pF;R_s, 5.3 MΩ; 25°C. In_A_–_C, mechanical steps were filtered at 0.5 kHz. D, Transducer currents in another outer hair cell (P7) in response to saturating excitatory and inhibitory mechanical stimuli (±25 V driver voltage), shown above. Holding potential, −84 mV. Currents (averaged from 5 repetitions) before (solid trace) and during (dotted trace) superfusion of FM1-43 were scaled and superimposed. Note that FM1-43 slows the kinetics on the excitatory step (time constant 1.1 msec) but has no noticeable effect on the kinetics after the inhibitory step. Maximum transducer current was −566 pA before and −240 pA during FM1-43 application. _C_m, 5.2 pF;_R_s, 7.1 MΩ; 24°C.E, Voltage jump experiment in a P7 outer hair cell, before (solid trace, 10 averages) and during (dotted trace, 8 averages) FM1-43 superfusion. The stimulus protocol is shown above. Holding potential, −44 mV, jump to −104 mV. Time constant of fit, 2.7 msec._C_m, 6.7 pF;_R_s, 5.3 MΩ; 25°C.F, Voltage-jump experiment in another outer hair cell (P7). Holding potential, −44 mV, jump to +96 mV. Solid line = control, 4 repetitions; dotted line = FM1-43, 10 repetitions. Fit time constant, 13.8 msec. _C_m, 6.1 pF; R_s, 4.6 MΩ; 24°C. In_E and F, electrical stimuli and combinations of mechanical and electrical stimuli were alternated. Responses to electrical stimuli alone were subtracted from combinations of both stimuli to eliminate linear leak and voltage-dependent currents.
Fig. 9.
Intracellular perfusion of FM1-43 dye.A, Large mechano-electrical transducer currents of a wild-type CD-1 outer hair cell (P6) recorded 4 min after establishing the whole-cell configuration with 20 μ
m
FM1-43 in the patch pipette. The membrane potential was stepped between −104 and +96 mV in 40 mV increments from a holding potential of −84 mV. All records are single traces and are offset so that the zero-transducer current levels (responses to inhibitory stimuli) are equally spaced.B, Hair-bundle labeling in a homozygous mutant_Myo7a_ 4626SB outer hair cell in whole-cell communication with a patch-pipette containing 20 μ
m
FM1-43. Top panel, Fluorescence image captured 2 min after patch rupture. Note the presence of dye in the hair bundle of the mutant hair cell (arrow). The patch pipette is indicated by the arrowhead. Bottom panel, Corresponding DIC image showing the hair bundle (arrow) and out-of-focus patch pipette (arrowhead). Scale bar, 5 μm.
Fig. 10.
Protection from aminoglycoside damage by calcium chelation and FM1-43. A, B, Scanning electron micrographs showing the apical surfaces of outer hair cells from the basal ends of apical-coil cultures after exposure to 1 m
m
neomycin for 1 hr. The outer hair cells in cultures that were pretreated with HBHBSS alone for 10 min before aminoglycoside exposure (A) exhibit extensive blebbing at the cell surface. The outer hair cells in cultures that were pretreated with 5 m
m
BAPTA for 10 min before aminoglycoside exposure in the presence of calcium (B) do not exhibit surface blebbing. C_–_F, Scanning electron micrographs showing the apical surfaces of outer hair cells from basal-coil cultures. Outer hair cells in control cultures incubated in HBHBSS for a total time of 70 min (C) have a normal appearance. In cultures that have been exposed to 30 μ
m
FM1-43 for 70 min (D), surface blebbing (arrows) is observed around the base of the kinocilium in some of the outer hair cells. In cultures that have been exposed to 1 m
m
neomycin for 60 min after a 10 min preincubation in HBHBSS (E), extensive blebbing and disruption of the apical surface is apparent. Outer hair cells in cultures that have been preincubated in 30 μ
m
FM1-43 for 10 min followed by 60 min exposure to 1 m
m
neomycin in the presence of 30 μ
m
FM1-43 (F) are protected from the ototoxic effects of the aminoglycoside antibiotic. Scale bars (shown in B for A,B and in F for_C_–F): 3 μm.
Similar articles
- P2X antagonists inhibit styryl dye entry into hair cells.
Crumling MA, Tong M, Aschenbach KL, Liu LQ, Pipitone CM, Duncan RK. Crumling MA, et al. Neuroscience. 2009 Jul 21;161(4):1144-53. doi: 10.1016/j.neuroscience.2009.02.076. Epub 2009 Mar 9. Neuroscience. 2009. PMID: 19272432 Free PMC article. - Internalization of styryl dye FM1-43 in the hair cells of lateral line organs in Xenopus larvae.
Nishikawa S, Sasaki F. Nishikawa S, et al. J Histochem Cytochem. 1996 Jul;44(7):733-41. doi: 10.1177/44.7.8675994. J Histochem Cytochem. 1996. PMID: 8675994 - TRPA1-mediated accumulation of aminoglycosides in mouse cochlear outer hair cells.
Stepanyan RS, Indzhykulian AA, Vélez-Ortega AC, Boger ET, Steyger PS, Friedman TB, Frolenkov GI. Stepanyan RS, et al. J Assoc Res Otolaryngol. 2011 Dec;12(6):729-40. doi: 10.1007/s10162-011-0288-x. Epub 2011 Aug 31. J Assoc Res Otolaryngol. 2011. PMID: 21879401 Free PMC article. - Localisation of the mechanotransducer channels in mammalian cochlear hair cells provides clues to their gating.
Furness DN, Hackney CM, Evans MG. Furness DN, et al. J Physiol. 2010 Mar 1;588(Pt 5):765-72. doi: 10.1113/jphysiol.2009.179614. Epub 2009 Dec 21. J Physiol. 2010. PMID: 20026619 Free PMC article. Review.
Cited by
- Vital Dye Uptake of YO-PRO-1 and DASPEI Depends Upon Mechanoelectrical Transduction Function in Zebrafish Hair Cells.
Patterson AS, Dugdale J, Koleilat A, Krauss A, Hernandez-Herrera GA, Wallace JG, Petree C, Varshney GK, Schimmenti LA. Patterson AS, et al. J Assoc Res Otolaryngol. 2024 Dec;25(6):531-543. doi: 10.1007/s10162-024-00967-w. Epub 2024 Oct 21. J Assoc Res Otolaryngol. 2024. PMID: 39433714 - Berbamine Analogs Exhibit Differential Protective Effects From Aminoglycoside-Induced Hair Cell Death.
Hudson AM, Lockard GM, Namjoshi OA, Wilson JW, Kindt KS, Blough BE, Coffin AB. Hudson AM, et al. Front Cell Neurosci. 2020 Jul 29;14:234. doi: 10.3389/fncel.2020.00234. eCollection 2020. Front Cell Neurosci. 2020. PMID: 32848624 Free PMC article. - Slit/Robo signaling mediates spatial positioning of spiral ganglion neurons during development of cochlear innervation.
Wang SZ, Ibrahim LA, Kim YJ, Gibson DA, Leung HC, Yuan W, Zhang KK, Tao HW, Ma L, Zhang LI. Wang SZ, et al. J Neurosci. 2013 Jul 24;33(30):12242-54. doi: 10.1523/JNEUROSCI.5736-12.2013. J Neurosci. 2013. PMID: 23884932 Free PMC article. - Hair-Cell Mechanotransduction Persists in TRP Channel Knockout Mice.
Wu X, Indzhykulian AA, Niksch PD, Webber RM, Garcia-Gonzalez M, Watnick T, Zhou J, Vollrath MA, Corey DP. Wu X, et al. PLoS One. 2016 May 19;11(5):e0155577. doi: 10.1371/journal.pone.0155577. eCollection 2016. PLoS One. 2016. PMID: 27196058 Free PMC article. - Agonist-induced changes in Ca(2+) permeation through the nociceptor cation channel TRPA1.
Karashima Y, Prenen J, Talavera K, Janssens A, Voets T, Nilius B. Karashima Y, et al. Biophys J. 2010 Mar 3;98(5):773-83. doi: 10.1016/j.bpj.2009.11.007. Biophys J. 2010. PMID: 20197030 Free PMC article.
References
- Betz WJ, Bewick GS. Optical analysis of synaptic vesicle recycling at the frog neuromuscular junction. Science. 1992;255:200–203. - PubMed
Publication types
MeSH terms
Substances
LinkOut - more resources
Full Text Sources
Other Literature Sources


