E-cadherin regulates cell growth by modulating proliferation-dependent beta-catenin transcriptional activity - PubMed (original) (raw)
E-cadherin regulates cell growth by modulating proliferation-dependent beta-catenin transcriptional activity
A Stockinger et al. J Cell Biol. 2001.
Abstract
beta-Catenin is essential for E-cadherin-mediated cell adhesion in epithelial cells, but it also forms nuclear complexes with high mobility group transcription factors. Using a mouse mammary epithelial cell system, we have shown previously that conversion of epithelial cells to a fibroblastoid phenotype (epithelial-mesenchymal transition) involves downregulation of E-cadherin and upregulation of beta-catenin transcriptional activity. Here, we demonstrate that transient expression of exogenous E-cadherin in both epithelial and fibroblastoid cells arrested cell growth or caused apoptosis, depending on the cellular E-cadherin levels. By expressing E-cadherin subdomains, we show that the growth-suppressive effect of E-cadherin required the presence of its cytoplasmic beta-catenin interaction domain and/or correlated strictly with the ability to negatively interfere with beta-catenin transcriptional activity. Furthermore, coexpression of beta-catenin or lymphoid enhancer binding factor-1 or T cell factor 3 with E-cadherin rescued beta-catenin transcriptional activity and counteracted E-cadherin-mediated cell cycle arrest. Stable expression of E-cadherin in fibroblastoid cells decreased beta-catenin activity and reduced cell growth. Since proliferating cells had a higher beta-catenin activity than G1 phase-arrested or contact-inhibited cells, we conclude that beta-catenin transcriptional activity is essential for cell proliferation and can be controlled by E-cadherin in a cell adhesion-independent manner.
Figures
Figure 1.
Transient expression of ectopic E-cadherin. Epithelial and fibroblastoid FosER cells were transfected with an expression plasmid encoding full-length myc-tagged E-cadherin and processed for double immunofluorescence microscopy 24 h after transfection using antibodies to the myc tag (A–D) and β-catenin (A′–D′). Confocal images are shown. Bar, 10 μm.
Figure 2.
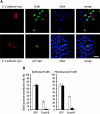
Expression of E-cadherin leads to G1-S phase arrest. Epithelial and fibroblastoid FosER cells were transfected with expression plasmids encoding full-length GFP- or myc-tagged E-cadherin and analyzed for BrdU incorporation and/or double immunofluorescence microscopy 24 h after transfection. (A) Confocal images of cells stained with antibodies to myc and BrdU (top) or to myc and p27KIP1 (bottom) and with the DNA dye Hoechst are shown. (B) Cells expressing E-cadherin–GFP or GFP alone as a control were analyzed for BrdU incorporation, and the percentage of BrdU-positive cells of all GFP-positive cells was determined by statistical analysis (>500 cells). Data represent mean values of at least three independent experiments; SD is shown. White bars, weak expression; black bars, strong expression of E-cadherin or GFP. Bar, 10 μm.
Figure 3.
Prolonged expression of ectopic E-cadherin caused apoptosis. Epithelial and fibroblastoid FosER cells were transfected with expression plasmids encoding full-length GFP- or myc-tagged E-cadherin, GFP-cadherin and β-catenin, or GFP as control. (A) GFP and E-cadherin–GFP–expressing cells were analyzed by FACS® within 4 d after transfection. The graph shows the percentage of E-cadherin–GFP– positive cells relative to GFP-positive cells (set to 100%) at each time point. Mean values and SD of at least three independent experiments are shown. (B) Epithelial FosER cells expressing ectopic E-cadherin were analyzed for apoptosis 48 h after transfection using the TUNEL assay and processed for immunofluorescence microscopy using myc antibody to visualize E-cadherin. Confocal images are shown. Bar, 10 μm.
Figure 4.
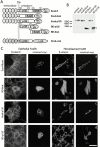
Expression of E-cadherin deletion mutants in epithelial and fibroblastoid FosER cells. (A) Schematic drawing of E-cadherin deletion mutants. p120 and β-cat denote interaction domains of E-cadherin with p120ctn and β-catenin, respectively. TM, transmembrane domain; numbers, position of amino acid in processed E-cadherin (B). Fibroblastoid FosER cells were transfected with plasmids encoding myc-tagged E-cadherin fragments. Cell lysates were prepared 24 h after transfection and analyzed by immunoblotting using antibody to myc. Asterisks denote position of construct. Control, nontransfected cells. (C) Transfected cells were processed for double immunofluorescence microscopy 24 h after transfection using antibodies to myc and to β-catenin. Confocal images are shown. Bar, 10 μm.
Figure 5.
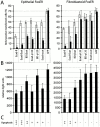
Growth-suppressive effect of E-cadherin fragments is strictly correlated with downregulation of β-catenin/LEF-1 transcriptional activity. Epithelial and fibroblastoid FosER cells were transfected with expression plasmids for GFP-tagged full-length E-cadherin, E-cadherin deletion mutants, E-cadherin–α-catenin chimera, or with GFP alone and analyzed for BrdU incorporation (A) and TOPFLASH activity (B) 24 h after transfection. (A) BrdU incorporation as in Fig. 2, depicting cells with weak (white bar) and strong (black bar) expression of ectopic proteins. (B) Cells were transfected with LEF-1–dependent TOPFLASH luciferase reporter construct together with expression plasmids encoding E-cadherin fragments and cytomegalovirus β-galactosidase reporter plasmid. Luciferase activities were normalized for β-galactosidase control. Mean values and SD of at least three independent experiments are shown. (C) Apoptosis in transfected cells was analyzed by microscopy. +++, >50%; ++, 30–50%; +, <30%; −, <1% of transfected cells were apoptotic.
Figure 6.
Upregulation of β-catenin activity rescues E-cadherin–mediated growth arrest. Epithelial FosER cells were transfected with reporter constructs and with constructs encoding E-cadherin alone or together with constructs expressing β-catenin or LEF-1 or TCF-3. 30 h after transfection, cells were lysed and analysed for β-catenin/LEF-1 reporter gene activity (A) as in Fig. 5 or E2F reporter gene activity (B). Graphs show mean relative light units of reporter gene activities (plus SD) normalized for β-galactosidase activity from at least three independent experiments. Control in B represents activity in asynchronously growing cells.
Figure 7.
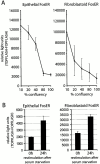
β-Catenin/LEF-1 activity depends on cell proliferation. (A) Epithelial and fibroblastoid FosER cells were transfected with TOPFLASH or FOPFLASH luciferase and β-galactosidase reporter constructs at different cell densities and analyzed after 30 h. (B) FosER cells were transfected with reporter constructs and starved for 48 h in medium without FCS and restimulated for 24 h in complete medium before analysis. Data obtained were normalized for β-galactosidase activity, and mean values of normalized TOPFLASH minus FOPFLASH activities of at least three independent experiments (and SD) are shown.
Figure 8.
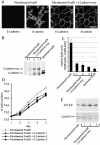
Stable expression of E-cadherin in fibroblastoid FosER cells reduces cell proliferation rate. Fibroblastoid FosER cells were stably transfected with a construct expressing myc-tagged E-cadherin, and three clones were selected by hygromycin resistance. (A) Confocal immunofluorescence images of fibroblastoid cells and stable E-cadherin–expressing cells stained with antibodies to E-cadherin and β-catenin. (B) Cell lysates of stable clones and of fibroblastoid and epithelial FosER cells as control were analyzed by immunoblotting using antibodies to E-cadherin. (C) TOPFLASH minus FOPFLASH reporter activities were measured as described in the legend to Fig. 7. (D) Growth curves of fibroblastoid FosER cells and stable clones were determined by cell counting in a Thoma chamber. Cell numbers were plotted as values against cultivation time to indicate doubling times_._ (E) Immunoblot analysis of total cell lysates using antibodies to cyclin D1 and p27KIP1. Bar, 10 μm.
Similar articles
- E-cadherin suppresses cellular transformation by inhibiting beta-catenin signaling in an adhesion-independent manner.
Gottardi CJ, Wong E, Gumbiner BM. Gottardi CJ, et al. J Cell Biol. 2001 May 28;153(5):1049-60. doi: 10.1083/jcb.153.5.1049. J Cell Biol. 2001. PMID: 11381089 Free PMC article. - beta-Catenin and TGFbeta signalling cooperate to maintain a mesenchymal phenotype after FosER-induced epithelial to mesenchymal transition.
Eger A, Stockinger A, Park J, Langkopf E, Mikula M, Gotzmann J, Mikulits W, Beug H, Foisner R. Eger A, et al. Oncogene. 2004 Apr 8;23(15):2672-2680. doi: 10.1038/sj.onc.1207416. Oncogene. 2004. PMID: 14755243 - The cadherin-catenin complex as a focal point of cell adhesion and signalling: new insights from three-dimensional structures.
Gooding JM, Yap KL, Ikura M. Gooding JM, et al. Bioessays. 2004 May;26(5):497-511. doi: 10.1002/bies.20033. Bioessays. 2004. PMID: 15112230 Review. - Defective E-cadherin/catenin complexes in human cancer.
Van Aken E, De Wever O, Correia da Rocha AS, Mareel M. Van Aken E, et al. Virchows Arch. 2001 Dec;439(6):725-51. doi: 10.1007/s004280100516. Virchows Arch. 2001. PMID: 11787845 Review.
Cited by
- N-Cadherin Induction by ECM Stiffness and FAK Overrides the Spreading Requirement for Proliferation of Vascular Smooth Muscle Cells.
Mui KL, Bae YH, Gao L, Liu SL, Xu T, Radice GL, Chen CS, Assoian RK. Mui KL, et al. Cell Rep. 2015 Mar 10;10(9):1477-1486. doi: 10.1016/j.celrep.2015.02.023. Epub 2015 Mar 5. Cell Rep. 2015. PMID: 25753414 Free PMC article. - A fine-tuned β-catenin regulation during proliferation of corneal endothelial cells revealed using proteomics analysis.
Maurizi E, Schiroli D, Zini R, Limongelli A, Mistò R, Macaluso C, Pellegrini G. Maurizi E, et al. Sci Rep. 2020 Aug 14;10(1):13841. doi: 10.1038/s41598-020-70800-w. Sci Rep. 2020. PMID: 32796906 Free PMC article. - Association of Csk to VE-cadherin and inhibition of cell proliferation.
Baumeister U, Funke R, Ebnet K, Vorschmitt H, Koch S, Vestweber D. Baumeister U, et al. EMBO J. 2005 May 4;24(9):1686-95. doi: 10.1038/sj.emboj.7600647. Epub 2005 Apr 7. EMBO J. 2005. PMID: 15861137 Free PMC article. - Hypersensitivity to contact inhibition provides a clue to cancer resistance of naked mole-rat.
Seluanov A, Hine C, Azpurua J, Feigenson M, Bozzella M, Mao Z, Catania KC, Gorbunova V. Seluanov A, et al. Proc Natl Acad Sci U S A. 2009 Nov 17;106(46):19352-7. doi: 10.1073/pnas.0905252106. Epub 2009 Oct 26. Proc Natl Acad Sci U S A. 2009. PMID: 19858485 Free PMC article. - Lessons and perspectives for applications of stochastic models in biological and cancer research.
Sabino AU, Vasconcelos MF, Sittoni MY, Lautenschlager WW, Queiroga AS, Morais MC, Ramos AF. Sabino AU, et al. Clinics (Sao Paulo). 2018 Sep 21;73(suppl 1):e536s. doi: 10.6061/clinics/2018/e536s. Clinics (Sao Paulo). 2018. PMID: 30281699 Free PMC article. Review.
References
- Anastasiadis, P.Z., and A.B. Reynolds. 2000. The p120 catenin family: complex roles in adhesion, signaling and cancer. J. Cell Sci. 113:1319–1334. - PubMed
Publication types
MeSH terms
Substances
LinkOut - more resources
Full Text Sources
Other Literature Sources
Miscellaneous

